Looking at 2019 in the rear-view mirror, this post will summarize the main studies from our group and others on one of our current research topics: force-velocity-power assessment and training. The following list includes the most significant updates and discussion points (in my opinion), and the main practical take-home messages.
Links to people and references appear within the text, just click!
Jump force-velocity profile made simpler: from multiple loads to two-load testing
A key question I have discussed with elite (e.g. NBA, Rugby) staffs is the fact that the significant amount of information that is given by a jump force-velocity profile test comes at a cost: testing time. Although Pierre Samozino and our group proposed a very simple and accurate approach allowing field testing, drawing the linear FV relationship requires 4 to 6 jumps and 2 trials per jump to ensure quality data and accurate extrapolation of the extreme values “F0” and “V0”. Long ago, we discussed and tried with master students to test the reliability of the jump FV profile drawn from only 2 load conditions. After all, a nearly perfect line is a nearly perfect line, whether it is drawn from 4, 6, 10 or 2 points…
We never published our results, and I was very happy to see that Amador Garcia-Ramos, and the research team led by the late Slobodan Jaric did this comparative study, and concluded that yes, information is preserved when only testing athletes with 2 loads. These results were published in the journal Sports Biomechanics, and one very important result is that not all 2-load combinations are made equal. For the quality of information (FV slope, F0, V0 values) to be preserved compared to the “full” protocol, the 2 loads chosen should be “extreme”: no load (squat jump or countermovement jump with body weight as a resistance) and a load that only allows jump performance of about 10 cm. In the population tested, and in our own practice, this is a load equivalent to 75-80% of athletes’ body mass.

In practice, using the free spreadsheet we’ve published, the full test (4-6 loads) can be replaced by a quicker “2-load test”, and provide the same information, as shown in this typical example:
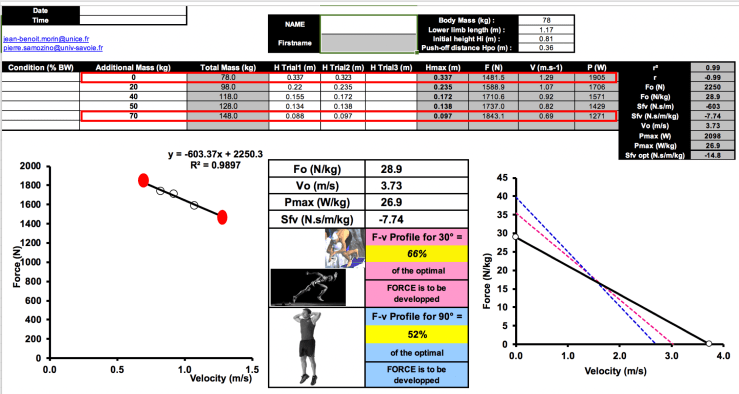
On the accuracy of the linear extrapolation of axes intercept values of force (F0) and velocity (V0) from central experimental points, two studies from Pierre Samozino’s research group will clearly push knowledge forward. The first one, published in 2017 focused on the force axis. Results showed that the half-squat 1RM point (highest force output reachable experimentally in concentric push-off conditions) was aligned with lighter loads points. The second one, under review, will focus on the velocity axis, and show, thanks to a specific ergometer device, the maximal lower limb extension velocity experimentally reachable is (i) close to 80-90% of V0 and (ii) corresponds to an experimental point also aligned with the rest of the profile. The next point will discuss the linearity of the force-velocity relationship. Follow PhD student JR Rivière for updates.
Take-home: after full familiarization, you can quickly and accurately obtain detailed information about your athletes’ jump force-velocity profile based on a 2-load test (0% and 75% of body mass), their jump height and this spreadsheet, in which you just use 2 load lines (delete the entire line of data you don’t use).
By the way, is the force-velocity relationship linear or hyperbolic?
The question, as written here does not make sense. It cannot (and should not) be answered without asking for a more accurate level of interpretation: what force-velocity relationship are we talking about? From the microscopic, isolated muscle fiber scale to the macroscopic, full-body exercise such as lower limb ballistic extension, there are many different answers to that question. But the confusion is still reigning, even among highly knowledgeable scholars. For example, we were very surprised, at the end of a symposium about jumping force-velocity (so macroscopic, multijoint context, clearly linear or very close to a linear relationship) to get the following question: “physiology says that the muscle force-velocity relationship is not linear, it is hyperbolic”. Two answers: first, we are not talking about the same level of analysis, YES, the relationship is hyperbolic-curvilinear in isolated fiber/muscle experiments and YES, it is linear or very close to in multi-joint “real-life” exercises such as a vertical jump. Second answer: force plates don’t lie. When plotting average force output versus the average center of mass velocity output during a push-off in various load conditions, force plate data provide a linear relationship (see figure above).
A first detailed analysis of this question was published in 2012 by Marteen Bobbert (apparently often overlooked publication…). In 2019, a detailed, comprehensive review was published on the topic (open access) by Julian Alcazar and colleagues. This work clearly answers the question and is a very good basis if you want to have a clear view of the state of the art about this topic.

By the way, very interestingly, Alcazar et al. re-analyzed data published by A.V. Hill himself in 1922 (a reference often used to support the hyperbolic trend…) obtained during the elbow flexion exercise. If force output (not mechanical work) is plotted against movement velocity, the relationship is clearly linear.
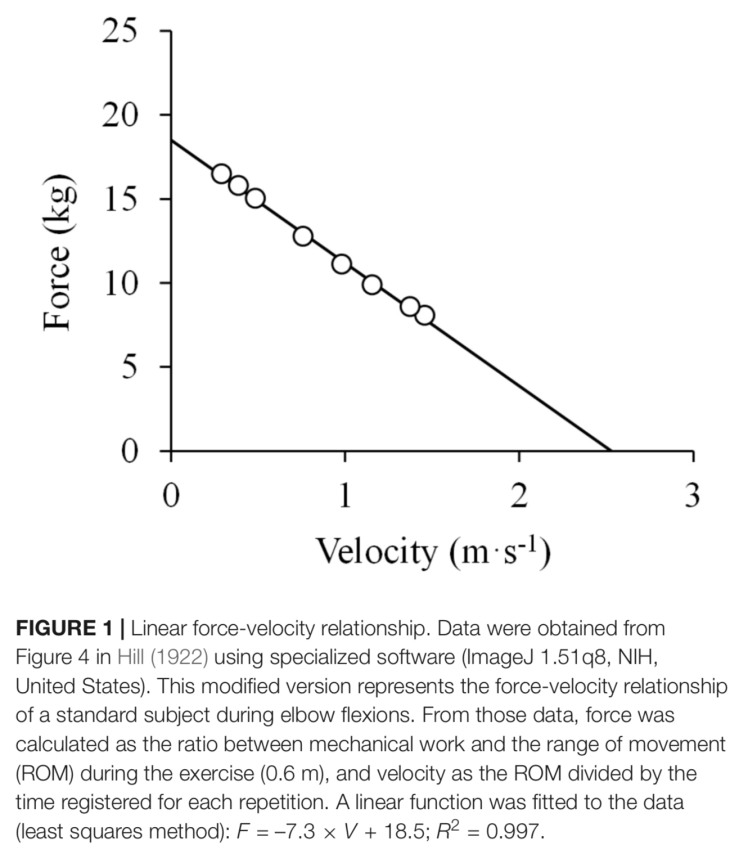
Then, discussing whether a R2 value of 0.98 obtained from 4-6 data points is more or less linear than 0.96 is pointless, and I won’t spend too much time and energy on these never-ending, sterile debates.
Take-home: the force-velocity relationship during exercise can show very different shapes, from hyperbolic to linear, depending on the level of analysis considered, from single, isolated muscle fiber to full-body scale exercises such as the vertical jump. For the latter, force plates don’t lie, and works published or in progress clearly show a linear (or quasi-linear if you like 0.5%, split hair discussions).
Is Squat Jump or CounterMovement Jump performance a reliable indicator of lower limb power output?
Jump height has long been considered a good indicator of lower limb capability to generate mechanical work and displace body mass over time during the push-off phase. The latter is an acceptable definition of mechanical power output at the level of the center of mass, and the consequence of muscle work generation capability. However, just as a 2-mile running time or a Cooper test 12-min running distance cannot be taken as reliable indicators of the interaction of underlying physiological features of an athlete (e.g. VO2max, running energetic cost), jump height only gives a broad idea of the underlying physiological determinants. In a commentary paper published in Sports Medicine, we discuss the sources of inaccuracy in the jump height – power and maximal power output relationship. We also show some examples of rather low correlations between jump height and maximal power output, both measured with reference devices (force plates) and methods (apex of the load-power relationship), especially in highly trained athletes. These sources of bias include body mass, push-off distance, optimal load, and optimal force-velocity profile. We also show that in worst-case scenarios, under- or over-estimation of lower limb maximal power output can reach 20 to 40%, for a same given jump height!

This publication was also the first for which we published the paper content ahead of journal submission to (i) collect comments from colleagues in order to improve our draft (pre-review process) and (ii) use the overall interest markers as arguments to convince the Editor about the interest of sending the paper to review. This has been discussed in a previous blog post.
Take-home: if you don’t have a force plate system and want a very raw idea of an athlete’s lower limb power capabilities, then use squat jump or countermovement jump height. You will play a lottery with a risk of making up to 40% under- or overestimation. Jump height very accurately informs about jump height capability. If you want more accurate and detailed information about the physiological and mechanical individual underpinnings of jump performance, then use the jump height information and the previously mentioned free spreadsheet to calculate everything. This method has been validated against force plate measurements 10 years ago and the validation against reference methods confirmed by 5 subsequent studies, 3 of which from independent research groups. Force plates don’t lie.
Jump force-velocity profiling procedure: what starting position should we use?
A very comprehensive and timely study was published in 2019 by Danica Janicijevic and colleagues in 2019. Three aims addressing three important practical points were (i) check the effect on the force-velocity outputs of using a standard one-size-fits-all starting position with knees at 90° versus subjects individually preferred starting position around 90°, (ii) re-test the validity of Samozino’s computation method against force-plate data and (iii) re-test the validity of using only 2 loads, as discussed before, compared here with 3 points. The starting position question is key since it has been theoretically and experimentally shown that push-off distance (influenced by anthropometrics but also starting position of countermovement jump) influenced jump height. The classical Bosco testing battery recommends setting a fixed 90° knee angle for all athletes tested, and our research and training practice clearly shows that this is sub-optimal for many athletes. Instead, it is preferable to use a self-selected starting height around 90° (which still allows to accurately determine the associated push-off distance). Added to the results of this study, our own experience shows that (compared to a fixed 90° knee angle) the preferred starting height will induce less measurement and inter-trial variability, overall better performance and more comfort for an all-out ballistic push-off.

This study also confirmed the overall validity of Samozino’s model equations compared to force plate data, and the take-home message is the exact conclusion of the authors:
Take-home : The routine testing procedure of the F-V relationship could be simplified using the preferred SJ starting position, Samozino’s procedure and the two-point method.
Improving vertical leap with an individually tailored training program based on the “force-velocity imbalance”: Part II.
Taking all these published methodological improvements, Pedro Jimenez-Reyes published a study in 2019 (open access) that in fact started in 2017. We designed this new intervention to address the three main limitations of our previous study aiming at testing the effectiveness of an individually tailored training program for jump height based on the concept of “force-velocity imbalance”, i.e. the relative difference between your actual FV profile and the computed optimal one. Briefly, the difference between these two profiles (type and magnitude) indicates the type of work that you need to prioritize during training in order to (i) reduce your imbalance and/or increase your level of maximal power output, and in turn (ii) improve your jump height. The first experimental evidence of the effectiveness of this innovative approach showed clear and systematic benefits compared to a control one-size-fits-all program (see the full paper here). But the 3 main limitations of this pilot study were that (i) the training duration was fixed (9 weeks) and of course not adapted to every single subject tested, (ii) during these 9 weeks, no intermediate testing was performed so we could not explore the individual adaptation kinetics and more importantly adapt the training content in case of change in the FV imbalance category (e.g. from large force deficit to small force deficit) and (iii) no test was done after the end of the protocol to inform about the changes in profile and imbalance after cessation of the specific training stimulus. By the way, the latter point is, in my opinion, the most overlooked phenomenon in training science literature…almost no study I’ve read informs (with post-intervention testing) about the “de-training” effect or at least the “post-intervention changes”…Studies proudly show what changes (or not) between pre- and post-intervention, but almost never what changes (or not) when the specific stimulus studied ceases. From a practical application perspective, this is a huge limitation we all need to consider ASAP.

This paper is very detailed and open access so you can download and read it. Briefly, the results clearly confirm the 2017 conclusions, and add important practical conclusions: (i) the training time needed to reach the optimal profile zone is individual and overall well correlated to the initial magnitude of FV imbalance, (ii) training content can be regulated to follow the individual adaptations and changes in FV profile and imbalance, for a more finely tuned intervention, and (iii) for 3 weeks after specific stimulus cessation with athletes resuming to their normal sports activities only, no major change was observed in the FV imbalance, and a slight average decrease in jump height was due to loss in maximal power output.
During the past year, I was very happy to see that this training approach was used in many high-level contexts in many sports, and used in some publications, for example, to train ballet dancers so they can improve their jump height, and in turn their artistic potential. I enjoy but do not know a lot about ballet dancing, but I guess that a couple more milliseconds in the air will allow dancers express and create more.
Take-home: Individually tailored training program based on the FV profile and imbalance is effective to improve jump height, and quick, regular assessment of the FV profile (e.g. using the 2-load method) allows a very finely tuned approach of the training and de-training individual adaptations.
Computing sprint macroscopic force-velocity and “power” output from position-time or distance-time data: clear confirmation
In 2013, Pierre Samozino presented for the first time, at the congress of the International Society of Biomechanics in Brazil, a simple method to compute ground reaction force and “power” output in sprinting. This method is based on position-time or running speed-time input data, and simply uses Newton’s laws of motion applied to the center of mass to calculate acceleration and then estimate the two components of the groàuind reaction force in the sagittal plan (i.e. vertical and horizontal) as a function of time during sprint acceleration. This method is based on the fitting of the position-time or speed-time data with an exponential model, which has been consistently observed and confirmed in several studies since A.V. Hill’s initial reports in the 1920’s. In 2016, our first paper (based on data presented at the ISB Congress 3 years before) showed the validity and reliability of this method in comparison to gold standard force plate data. The measurements were done at the INSEP institute in Paris, and due to the short length of instrumented track available (only 7 m), we had to use the method of Cavagna et al. in 1971. In this approach, data for a full-length sprint acceleration (about 40-m) are gathered from several trials for each sprinter and used to form a “virtual single sprint” dataset for comparison. Samozino’s macroscopic model has been used in more than 20 studies to date and the reproducibility clearly confirmed. It allowed us and others to push the knowledge on sprint performance forward. However, despite the proven reliability of the “multiple trial” approach, some grumpy (bitter-jealous?) colleagues were still skeptical about the validity of the method. In 2019, we were able to build a collaboration project with Dr Ryu Nagahara, the lucky “owner” of a fully equipped, 60-m track, and test the validity of Samozino”s method, this time during single sprint accelerations. If you are not familiar with Ryu’s work on sprint mechanics, then you have a clear learning objective for 2020. Force plates don’t lie…Briefly, the results showed exactly the same as in the initial 2016 study and brought a full description of sprint acceleration macroscopic force and power outputs based on gold standard data. Interesting comment from one of the reviewers: this validation study was not necessary since all computations are based on Newton’s laws of motion applied to the center of mass of a runner, it is obvious that they provide accurate estimates. We agree…and the bases of the computation method have been described in the seminal works of A.V. Hill on sprinters…but confirmation is always interesting, and necessary.

Two other important papers related to the topic of measuring and estimating “power output” in sprinting have been published in 2019. The first one by Andrew Vigotsky et al. discusses terminology issues in the field of biomechanics, including the fact that the power output associated only to the force developed in the horizontal direction should be termed “quasi-power”. The second one by Gaspare Pavei et al. is a very comprehensive analysis of the various types of “power output” in sprinting. These colleagues showed that the power output derived from center of mass speed fitted with an exponential model (as in Samozino’s method) was only a minor part of the total mechanical power output developed by muscles. Specifically, the macroscopic method described above does not consider power output associated with “internal work” i.e. limbs motion relative to the center of mass and “intra-step” changes in mechanical power output associated with well-known intra-step changes in running speed and center of mass vertical position. We fully agree with the conclusions of Pavei et al., but it is important to note that the simple macroscopic model we use only aims at quantifying external mechanical power output (as done in the literature for rowing, cycling, walking or running external power) but the following arguments (and tracks of research) should be clearly kept in mind. First, although clearly under-estimating the actual total power output developed by muscles, the step-averaged “quasi-power” calculated from center of mass speed is clearly related to performance and distinguishes athletes with different levels of sprint performance. We don’t know if this is the case of “internal power” or “intra-step power”. Second, the devices and methods necessary to calculate internal and intra-step power outputs (multiple camera motion capture and analysis system, ground-based opto-electronic devices for contact and aerial times throughout the sprint acceleration phase) are clearly limiting the ability of field practitioners to quantify these mechanical variables. Future research should address the important question of the relevance of these other sources of mechanical power output to sprint performance and the feasibility of field measurements. For now, research has shown that the macroscopic step-averaged “quasi-power” output at the center of mass, in the direction of motion (i) represents the « effective power » which allows athletes to accelerate from one step to the next one, (ii) is a clear performance indicator, as shown in several studies with leisure to elite-level athletes, (iii) is accurately estimated in field conditions by anyone able to use a 120fps or more GoPro camera, an iPhone or an iPad (see next point), and so (iv) represents the first “big-picture” step to analyze sprinting mechanical outputs.
Take-home: Estimating sprint acceleration power output associated with center of mass acceleration is possible from simple position-time or running speed-time data. The validity of this simple method has been confirmed with single sprint, gold standard force plate data.
Sprint “simple method” methodological updates: simpler, better, cheaper
I guess you’re familiar with the iOS app named “MySprint” developed by Pedro Jimenez-Reyes based on the macroscopic model we’ve developed and validated. As explained in this blog post, all you need to compute the key sprint variables is to film the sprints, and fill our free spreadsheet as explained here.
In 2019, we’ve had very interesting discussions with elite staffs (NBA and elite rugby) about the possibility of (i) shortening the testing length and (ii) filming the sprints closer than the recommended 10m and with other devices than an iPhone or iPad. We have tested some alternative solutions and some colleagues published confirmation data, and there are plenty of good news.
Firstly, yes, the test can be shortened, since the model is based on 0 to top speed data. So if a tall-big basketball or rugby player (or young football player) reaches top speed within say 20-m, the split times at 5, 10, 15 and 20-m can be used (using the very same MySprint settings as for the full test) and inserted in the spreadsheet. Anyway, the spreadsheet shows the quality of the exponential fitting via the “sum of square differences” cell and the graphic adjustment between split time points and the modeled position-ctime curve in blue.
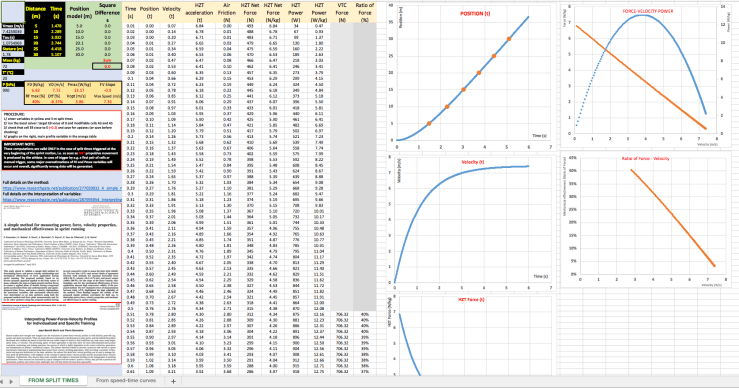
Secondly, for those using (very expensive and not user-friendly) timing gates and not able to collect more than 3 or 4 splits (where the method recommends 6), two studies by Ken Clark and Thomas Haugen, and our own experience, show that in fact, the exponential model for position-time data is accurate with only 3 splits. So just like the “2- or 3-load method” for jump profiling, sprint profiling can be done with “only” 5, 10 and 20-m times in athletes reaching top-speed within 25-30m…i.e. >95% of athletes. To verify this, just use a standard test data, remove the split times other than 5, 10 and 20-m and re-run the excel solver for data fitting…the exponential function and its determining variables (Vmax and Tau) remain the same or close.
Thirdly, if you use a radar device or a speed-measuring device like a laser or a 1080Sprint, you can run the sprint FV analyses using the “speed data” sheet of our spreadsheet.
Finally, just like using MyJump2 is not compulsory to measure the input of our approach (jump height), MySprint app is not compulsory to measure the input data for the sprint method! Don’t confuse the input data with the apps that allow measuring them…It is not a “MyJump2” or a “MySprint” test, it is a jump or sprint force-velocity test based on jump height or sprint times/speed as inputs. So if the inputs are measured accurately, the test is valid, regardless of the device/technology used. So basically a “new” method we have experienced and discussed is to simply use a GoPro camera or any video-recording device that has good resolution for more than 120 frames per second (validity threshold in the validations studies for MyJump and MySprint apps), associated with Kinovea free software or similar to count frames and thus time, plus our free spreadsheets, et voilà! My personal opinion is that these apps and iOS devices are very cool and accurate, but the good thing is that our simple methods actually whatever the device used, provided it gives accurate inputs. This is also why, for now, data available did not totally convince me that GPS devices were ok to accurately calculate the sprint FV profile during all-out, straight-line sprint tests…more to come on this topic in 2020. On changing the settings and markers to adapt to various testing and filming distances, follow Lauri Stenroth and a cool study about to be published, elegantly using Thales’ intercept theorem to extend the feasibility of Samozino’s method to various testing conditions…Middle school mathematics is the most underestimated tool in sport science.
Take-home: It is now possible to analyze sprint macroscopic mechanical outputs based on Samozino’s method from speed-time data, or 3 to 6 split times over the acceleration distance, measured with (i) any video-recording device with a slow-motion above 120 frames per second, (ii) a software/app that counts frames and thus time and (iii) our free spreadsheet. Happy testing in 2020 everyone!
Applications: from Ice Hockey to elderly and Parkinson’s disease patients
What do NHL professional ice hockey players and 60-yrs old Parkinson’s disease patients have in common? Well, “sprint” acceleration on-ice is a key factor of performance for the hockey players, and sprint exercise is potentially a promising exercise therapy for mild-moderate Parkinson’s disease patients. And both can be tested/followed using the previously described method. My own consultant practice and researcher/reviewer activities led me to closely observe these two fields of application of our research in 2019. See for example this pilot study on ice hockey acceleration. More scientific literature is about to be published on the use of our method for ice hockey performance analyses. On the clinical side, the most fascinating track of research I see in the coming years is to consider sprinting as a time-efficient exercise for patients (able to do it of course) suffering from neurological diseases. Basically, the big difference between sprint running and the “classic” walking, jogging, cycling, Nordic walking, or lifting activities is that it involves no device, no setting, no assistance. It is just you, your body, your mind, and your will to run as fast as possible and push the “all-out” button. It takes 2 to 6 seconds and it is not risky if you are prepared well. Old people do run fast. Well, in fact, their “fast” is actually not younger people’s fast. All I’ve seen so far working with old people (see this study on Master athletes) or patients sprinting is a lot of joy, motivation, self-confidence and pride. The work of Elren Monteiro and colleagues from Brazil clearly paved the way, and they even observed some intriguing side effects like a decrease in “freezing” seizures during sessions.

“Pushing the all-out button” likely means much more than we think, physiologically and psychologically. This is what I’d love my own and other’s research to discover in the coming years. “Beating the clock” has likely a profound meaning for many of us, and that’s basically what sprinting involves.
Take-home: provided the acceleration pattern follows an exponential model as for “classical” track sprinting, the macroscopic mechanical outputs of human acceleration can be studied using the previously described method. Two examples published are ice hockey acceleration and sprinting in Parkinson’s disease patients
2019: pleasure and pain
On a more personal note, 2019 will always mean to me the pain of losing a brother. My young brother was a brilliant, innovative and relentless engineer and entrepreneur. His brewery, pub, and the local cycling club he founded and led basically changed the history of our small village, and brought joy and created good times to many. All the pleasure I take in my professional life is nothing compared to the pain I have now that he’s gone. He had so much passion for his own job that I now feel I need to enjoy my own passion for my job even more. A famous quote tells us that a man should plant a tree, have a baby and write a book. Our book was published in 2018, my kids are awesome, I just wish I never planted that f***ing memorial tree.
Music is the soundtrack of our lives, I’ll conclude this post looking forward to 2020 adventures with one of my favorite artists, Ben Harper and his song “Pleasure and Pain”.

Great post. Love your work. You’ve inspired me to go back and learn more maths. Also sorry to hear about your brother, many many condolences. Best regards, Jon.
LikeLike
Thanks a lot Jon!
LikeLike
Hello – I only recently learned of your blog and have been reading it, and articles linked from it, fervently ever since. Thank you for making such a wealth of knowledge available. Between your writing and various youtube videos, I almost feel as though I know you. As such, I was very saddened to hear of the passing of your brother. My deepest condolences. I hope 2020 is treating you well,
Brian
LikeLike
Thank you very much Brian, very happy you found these articles interesting, and thanks for your kind words
LikeLike