Written with Yann Le Mat, Cristian Osgnach, Pietro Enrico Di Prampero and Pierre Samozino
This post will present a novel approach to determine the individual acceleration-speed sprint profile in team sport players. The associated scientific paper has been published in the Journal of Biomechanics (access the full paper here), and the concept has been first presented during a Webinar organized by Gpexe on July 27, 2020 (see the 25′ talk below).
The overall idea came from the application of our research on the sprint acceleration force-velocity (F-V) profile. This concept is a useful method to assess, understand, monitor, and follow training (or detraining) of individual players sprint capabilities. It has been used in many studies and clubs over the past 10 years (see here for articles from our group). However, a key feature of this approach is that you need to specifically test the players (typically two single, all-out 30-m sprints) to get the necessary inputs. Although not very taxing, especially in sprint-based sports like football or rugby, the need for testing may be seen as a limiting factor to use the sprint acceleration mechanical profile in real-life scenarios. Test = stress. In addition, as mentioned in a recent paper by Mathieu Lacome et al., specific devices are needed to measure the input variables of either running position or speed over time. The reference devices in our studies and practice are timing gates, radar gun, and slow-motion video such as Gopros or apple devices and apps.
In modern football and other team sports, GPS Units or LPM systems are used consistently during both training sessions and games, which makes running position, speed and acceleration data available with pretty high sampling rate and spatial accuracy even without paying attention. In the recent article by Mathieu Lacome, quantifying the players individual sprint profile was made one step easier, by just analyzing the GPS data collected over two 0-to-top-speed sprints performed specifically for the test. Our most recent observations show that this is possible with GPEXE Pro2, Catapult S7 and Statsports Apex units.
Good point: no additional devices are used, and the data processing is smooth and fast, which allows testing many players within minutes. Limitation: a specific linear sprint up to top speed is still needed. In some contexts, this exercise can be perceived as boring, risky, not specific enough, etc…regardless of the very useful information obtained for individualized training, fitness-fatigue monitoring or rehab purposes.
So the main question we’ve tried to address was: how to obtain an individual sprint acceleration mechanical profile conceptually equivalent to our “classic” F-V profile without running a specific linear sprint test?
Basics: interest of the individual sprint acceleration force-velocity profile
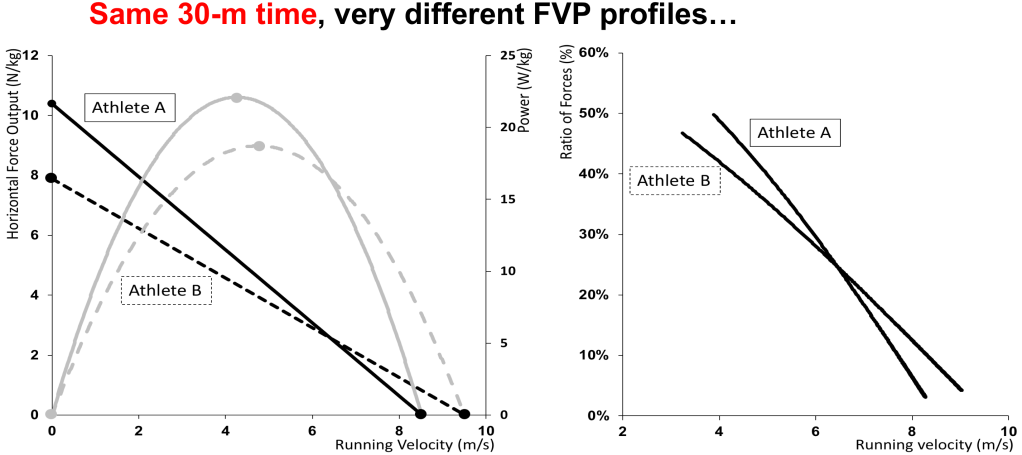
In a 2016 study, Dr Pierre Samozino and myself commented on the practical applications of the sprint F-V profile, which could help better understand the muscular determinants of overall sprint acceleration performance. Time over a given sprint test distance is in fact a very poor level of information, that does not tell about the underlying mechanical outputs. For example, the two rugby players tested in this example show similar times at the sprint acceleration test, but very different mechanical profiles. In our opinion, this should support the fact that they will respond and thus benefit from (at least partly) different training stimuli, given that they have different mechanical characteristics and profiles.
This individualized approach “digs deeper” into the assessment and training of sprint mechanical outputs has been used by various research groups in football, soccer, rugby and other sports to characterize elite athletes, or rugby players, study seasonal changes, the effect of resistance training or assistance training, repeated sprints, etc. In the context of hamstring injury rehabilitation, we also showed that the F-V profile remained clearly altered (on the force side) after return to sport, which triggered recent and ongoing investigations in the hamstring injury prevention and rehab context (see publications by Jurdan Mendiguchia and this presentation by Johan Lahti).
Before being widely used in applied research and training contexts, this method has been tested and validated against gold standards. It is based on a modelling of the position- or running velocity as a function of time by a simple exponential function. Our first use of this modeling was published in a 2005 paper, after Pr Di Prampero invited me to collaborate on this project during my PhD thesis dissertation, but the fact that human running acceleration shows an exponential increase of center of mass speed over time has been consistently observed for years. Research papers from the 1920’s by Nobel Prize winner Archibald V Hill already reported this simple mathematical feature of a very complex movement.
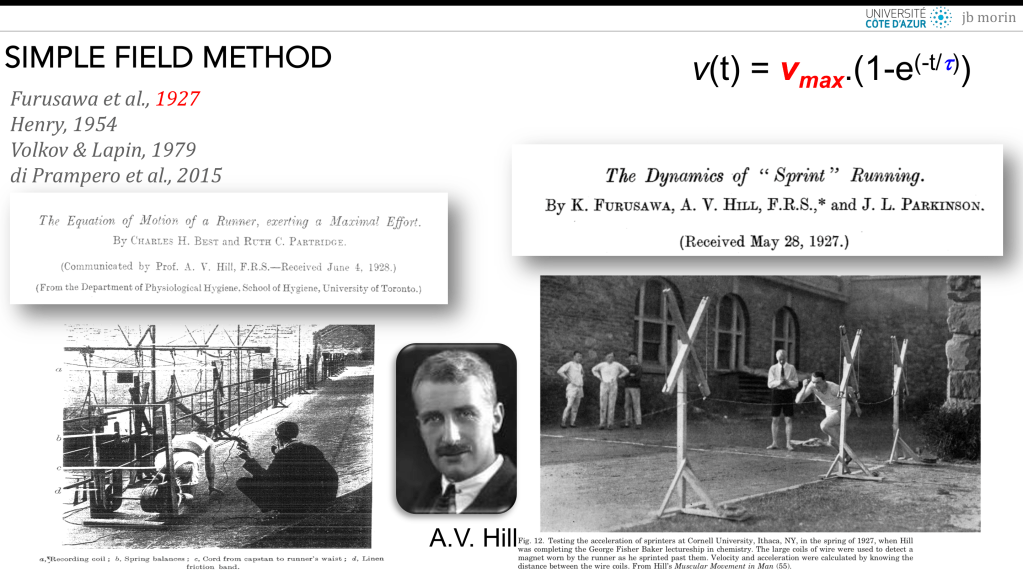
This exponential fitting has then been observed and used in studies from the 1950’s, 1980’s, and 2000’s. The most recent study we’ve published on the topic showed the very high goodness of fit of this exponential increase in center of mass speed, and the validity of the ground reaction force computation derived using Newton’s laws of motion. For a fully detailed presentation, see this online conference.
So in summary, the approach works, you can calculate ground reaction force magnitude and orientation, velocity and the associated “horizontal” power output during sprint acceleration in football players, even using GPS devices. But you still have to plan, organize and run a specific test for each player…
Innovation: the “in-Situ” acceleration-speed (A-S) profile
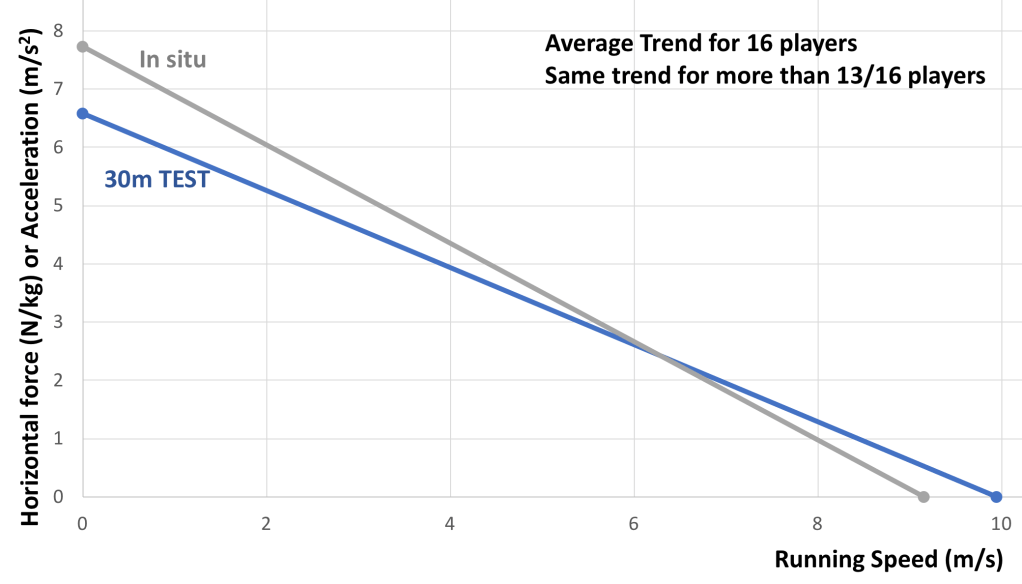
The game was simple: how to get the individual “line” of horizontal force (or equivalent forward acceleration) data that represents the spectrum of maximal acceleration/force output as a function of running speed, from low to maximal speed. During a single sprint test, assuming the intensity and intention are maximal throughout the sprint, players produce their maximal possible acceleration (thus force) in the forward direction at each instant from 0 to maximal running speed. Physiology of exercise dictates that force capability decreases as velocity of movement increases, and in sprinting, forward acceleration capability decreases linearly as sprint velocity increases. So when a player runs a 30-m linear sprint test, the relationship between horizontal force- or acceleration- output and running speed is linear (see the Figure above). At the very beginning of the sprint, speed is low and acceleration is high. By the end of the sprint, speed is maximal and acceleration minimal or even null (when top speed is reached). This linear relationship is the result of a constantly maximal intent of the players throughout the sprint, under neuromuscular constraints. If we were able to produce the same maximal acceleration at any given running speed, sport would definitely be super fun: non-stop Mario Kart turbo boost!
This is the key thought process we had: if the single test profile is the result of maximal acceleration intent at each possible running speed, maybe we can “reconstruct” this individual spectrum by collecting enough acceleration and speed GPS data to get, for each running speed reached, the corresponding maximal acceleration produced. Et voilà.
I think we also had this idea after some meetings with Pr Di Prampero about 10 years ago when we tried to assess the energy cost of sprinting. Our preliminary experiment consisted in measuring oxygen consumption before (standing basal metabolism), during, and long after a single all-out sprint. I always kept in mind the simple words of Pr Di Prampero then: “you want to estimate the energy cost of a single sprint? Measure then entire oxygen consumption and then deduce the sprint-induced excess of oxygen consumption above the baseline”. Beyond the very interesting physiological approach, what struck me was this idea of “quantifying everything” and then analyzing the data correctly to answer your research question. This is exactly what the in-situ A-S profile is about: recording every single move by a player on the field, and process the data as necessary. Without the player even noticing a “test” is carried out.
In the following figure, the linear trend is computed from the 2 maximal acceleration points collected for every 0.2 m/s increment from 3 m/s to the player’s maximal running speed. So, a total of 40-70 data points depending on players’ capability.

The maximal acceleration and running speed actually reached are taken into account, but as for the F-V profile, the extrapolated axes-intercepts a0 and s0 represent the theoretically maximal acceleration and speed capability of the player in the specific football context.
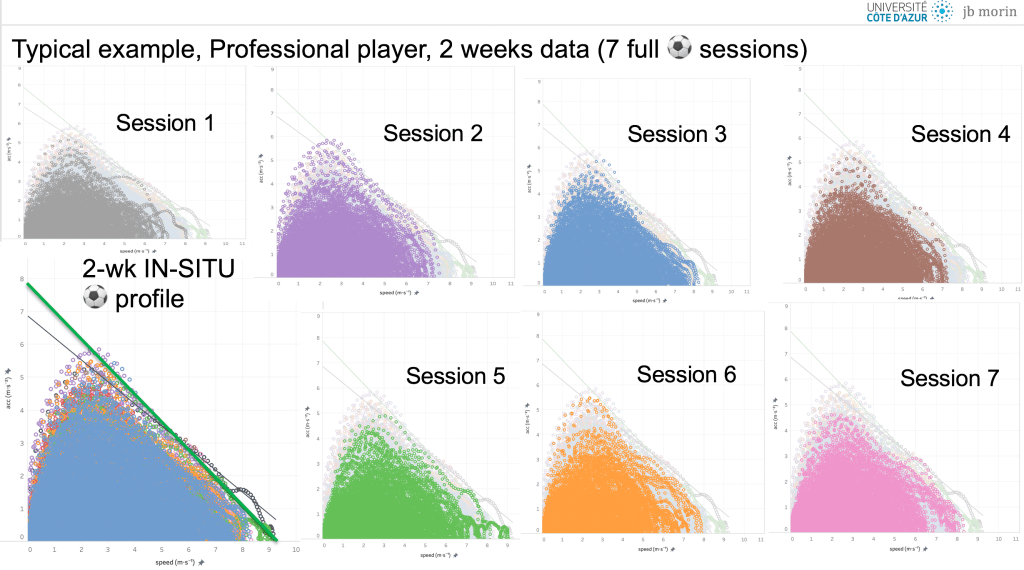
In this other example, 7 sessions of training were analyzed in a professional player and pooled to build the 2-week A-S profile. Note that this profile is specific to that player only, for that 2-week training period only. Here, a0 was about 8 m/s2 and s0 about 9.2 m/s. This player performed a sprint test (single 30m classic standing-start sprint), and then data were analyzed again to build the A-S of the 2 subsequent weeks. These two A-S profiles are a little bit different but very close, and different from the sprint test one.
As a cycling fan, I think this idea of building the equivalent output of a test by analyzing a big amount of “non-test” data was also influenced by what Dr Fred Grappe (my supervisor during the Masters’) and Julien Pinot published: the “Power record profile”. Instead of running a single all-out 3- or 5-min or 3-h test to get riders power-duration profile, they collected all power data from several training sessions or races, and kept the maximal power output for each time window (from a few seconds to a few hours) to build the individual power-duration relationship…testing the athletes without testing them! This overall concept is based on the fact that over a few training sessions and races, riders will express at least once their maximal power capability over e few seconds (e.g. a sprint here and there) to a few minutes (e.g. a time trial, or a fast climb), which will eventually build the virtual equivalent of a “single all-out test”.
In football or other team sports such as rugby, players likely reach the full spectrum of running speed and acceleration if data of several training sessions are pooled. One difference however is that cycling power is measured accurately during official races, while inside a professional football stadium, the GPS signal on game day may not be correct enough to ensure data validity during an official match inside a big stadium.
“How much data do you need to build an A-S profile” is a pretty frequent question . Well, it is not a matter of quantity of data (remember a single all-out test is enough) but rather quality of data: did the player cover their entire spectrum within the time window you want to consider?
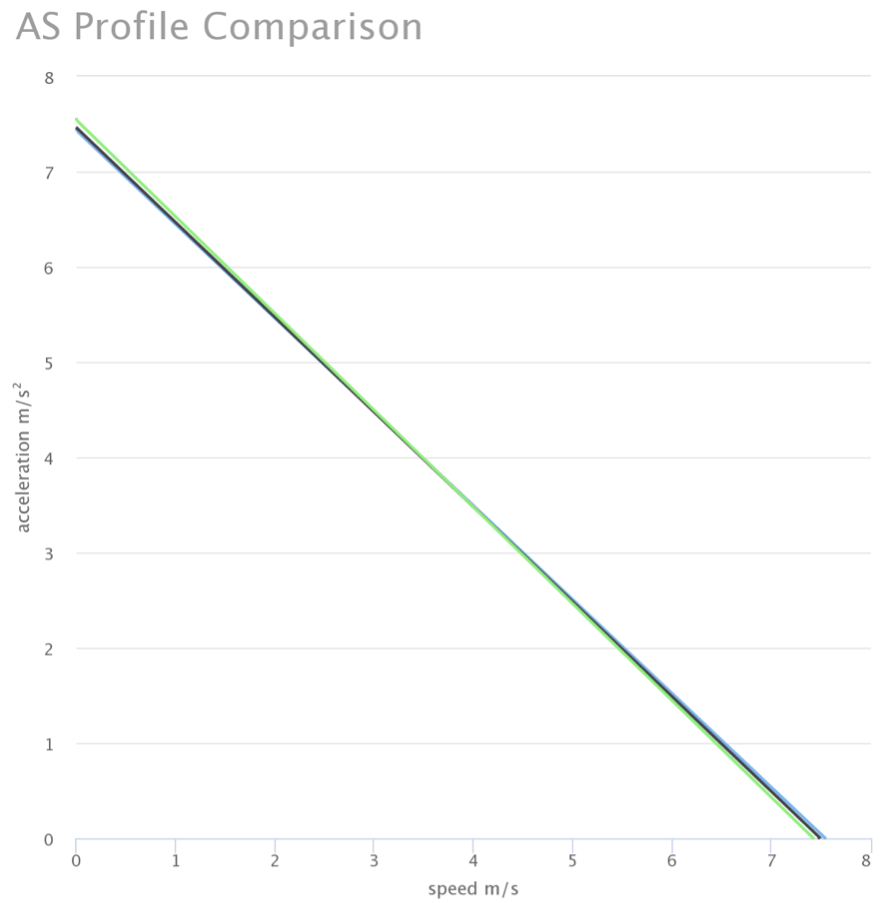
Our most recent observations show that several sessions (or for example a full Rugby 7s tournament in the World Series) may not be enough to generate a “full cloud” of data that includes maximal acceleration points at all possible running speeds. Contrastingly, a 45-min football training session that includes all types of runs led to a clear and interpretable cloud of data:
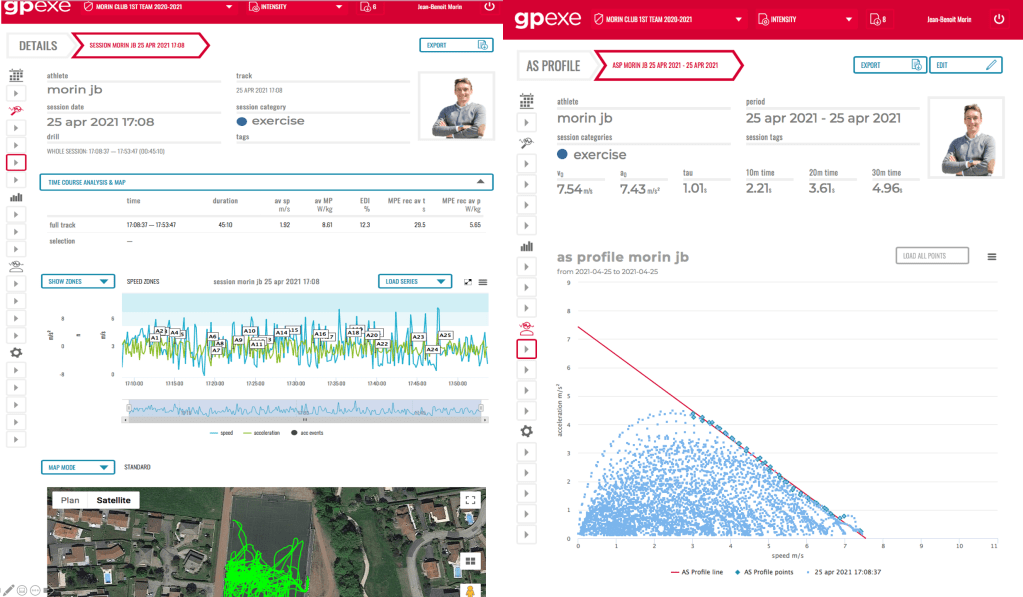
In practice, a free website and tutorial
Thanks to the work of Yann Le Mat, you can access a free online page (click here) where you can download a typical .CSV file to format your data and then upload them into the website. Based on time, speed and acceleration data from your GPS system, it will display the corresponding cloud of data and the main A-S profile outputs. A short video tutorial is available here:
Force-velocity sprint profile versus “in-Situ” acceleration-speed profiles: same but different
Conceptually, the maximal theoretical running speed of the A-S profile (s0) and “v0” are similar: they express the theoretical maximal running speed at which the player could run, but they differ in that one is derived from football situations and actions (s0) while the other is the extreme of a linear sprint task (v0). In the same way, a0 and F0 carry the same information, since the acceleration-velocity and horizontal force-velocity profiles only differ by the amount of air friction:
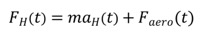
For instance, in this simulation of a sprint test, the F-V and A-V profiles are very close, and equal at the Y-axis intercept (Faero being null). Note that when expressed relative to body mass (in N/kg), F0 and a0 values are in the “same” units (N/kg and m/s2 being equivalent mechanical dimensions), and so values can be compared. Consequently, “normative” F-V variables available to the staff or published in the literature may be compared to in-situ A-S outputs.
This is why the A-S profile is not a “in-situ force-velocity profile”: one can estimate air friction pretty well over a single test (depending on running speed, air temperature and pressure), but not for a 2-week pooled set of data.
Overall, it is therefore important to remember that the classical F-V profile for linear sprint acceleration test and the novel A-S in-situ profile presented here carry conceptually similar but technically different information. It is thus likely not interchangeable information, and not “one or the other”: it all depends on what you want to assess with your players. The degree of individual difference between F-V and A-S profiles were addressed in the proof-of-concept study we will soon submit.
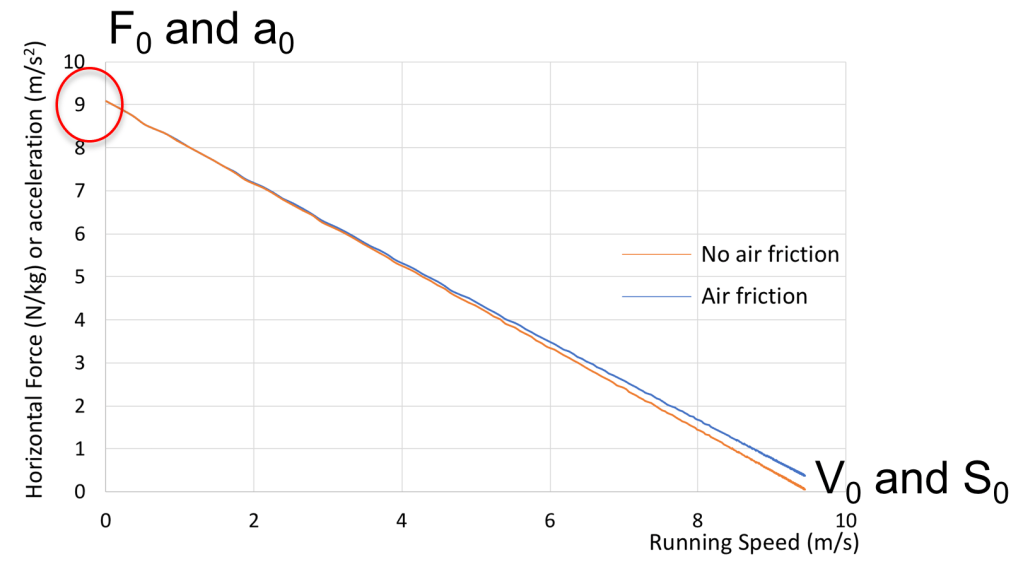
In the typical session presented before, I have compared the A-S profile of the session (removing the final single sprint trial from the 45-min dataset) to the single sprint F-V profile performed at the end of the session. In this example, the two profiles are almost equal, except that one was “football specific”, i.e. based only on football plays, while the other one was a single linear sprint test over 30-m…
Limitations: quality of input influences quality of output
A very important methodological point is that, as for all biomechanical or physiological models, the quality and reliability of input data directly influences the validity of the model’s outputs. So if for any reason (quality-accuracy of the time-speed-acceleration measurement system, GPS signal quality, etc) the raw data do not display the typical cloud of data presented above (with an overall triangle shape and points all over the speed spectrum), the A0 and S0 outputs will not make sense. So you should be very careful and not even try to interpret such output data, for example, if the cloud of data is not clear and/or the A0 and S0 data do not make any sense (eg A0 = 3 m/s2 and S0 = 20 m/s), it means that the model input data were wrong. It is as simple as that. The proof-of-concept study has been validated with GPEXE Pro2 units, and this does not mean that any type of GPS or IMUs brand-type will provide reliable data.
So until complementary studies are presented and clouds of typical raw data displayed, we do not know the validity of the concept for any type of GPS device. My personal experience shows that A-S profiles obtained with GPEXE and Catapult S7 raw data make sense. A presented below, I have seen very strange and invalid clouds of raw data, that are associated with unreliable outcomes.
What’s next: proof-of-concept study, preliminary results, and terra incognita
The preliminary data included in our study were collected in 16 professional players (Italy) in the September-October period. We compared two sets of 2-week pooled data and the corresponding in-situ A-S profiles. Overall, we observed low relative difference, systematic and random error of measurement for intra-player comparisons between the two periods compared (for the main variables of interest). These differences are of course due to both possible changes in the players A-S capabilities, and the actual content of football training sessions. This is one of the interests of the approach, it describes the A-S capabilities of players, within the specific context of their football training content and type.

The comparison between the in-situ A-S profile outputs (a0 and s0) and the corresponding single sprint test F-V profile outputs (F0 and V0) showed that values were overall within the same range (e.g. average of 9.16 m/s for in-situ s0 versus 9.42 m/s for the testing V0) but showed significant (although small) differences. This tends to show that, within the group of players and the context studied in our study sample, systematic differences (and low to moderate correlations) were observed between the in-situ and the sprint test mechanical outputs. The figure below shows that, in our sample, the maximal acceleration (or horizontal force) output tended to be greater in the in-situ data than in the single sprint test, while the opposite trend was observed for the maximal running speed capability
Studies are needed to compare these results to other contexts, other players, based on the methodology we present in our “proof-of-concept” paper. So basically, as always in research, one question answered leads to several other questions asked: is the in-situ A-S profile observed in other team sports (rugby, American football, etc…)? How does it change with fatigue, seasonal changes in players fitness, specific training? Is it different among players and positions? Is it influenced by small-sided games, format, tactical plans, type of playing or coaching style? Does it change with specific (football or physical) training, or detraining? Is it different at return to play after injury? And so on…
A first set of application exemples has been presented in this online webinar, with pre- and post- hamstring injury data showing that the A-S profile may be a very useful and specific tool to better guide individual rehabilitation and return-to-performance processes. In addition, a pilot study in elite rugby players shows that the A-S profile may be a very interesting way to directly test the effects of training (eg here a block of high-resistance sprint training) on the physical performance of players. This time not tested with a linear 30-m sprint but directly on their specific game moves and actions!
Watch this webinar here:

The exciting part of this new approach is that the input that is necessary to design studies and answer all these key questions is “just” good quality position-time data during training and possibly games. For example, the Figure above clearly shows that the data clouds differ between the 7 training sessions compared, some sessions putting more emphasis on maximal acceleration than others and vice versa for the maximal running speed. The in-situ A-S profile may also be used to better describe the physical consequences of football sessions within the “tactical periodization” and integrated physical work approach, etc…
Time to play ⚽️🏉🏈 !
References cited are directly accessible via URLs within the text.

Excellent.
LikeLike