Imagine a S&C coach starting a session with “ok folks, today everybody squats with either 80 kg, or 90% of body mass – whichever you prefer”. This would not make much sense since, as you know, that very same load will induce a different stimulus for different athletes. For some, it might be close to or even higher than their maximum for one repetition (1RM), for others, it may induce an exhaustion around 5-6 reps (5-6 RM) and for others, it may be too light and result in very fast movement. It is now well acknowledged in the training world that gym-based exercises should be individualized, and subsequently programmed to target neuromuscular stimuli (and in turn development objectives). There are various ways of managing this individualization, such as percent of 1RM.
On the track and in team sports, resisted sprinting is a common means of providing a sprint-specific overload stimulus. While there are several methods of applying resistance, the most common are sleds. Unfortunately, in both research and practice the way loads are regularly prescribed is still years behind the gym-based approach. Most of the time, coaches set a given load for all athletes (e.g., 7.5 kg or 10% body mass). There are two main issues with this approach. First, as described above with the squatting example, this does not consider each individual’s capacity; Second, unlike squatting, the overload in resisted sprinting is more complicated to quantify, and is primarily a product of friction – in sled sprinting this means accounting for both the load, and the interaction between the sled and the ground over which it is towed.
In the former instance, the same loading can result in different resistance relative to an athlete’s maximum capabilities, and accordingly the underlying neuromuscular qualities targeted. In the latter case, the same athlete with the same load across different facilities (e.g., different sled design and surface) can experience drastic differences in resistance (note: this is a real difficulty when trying to synthesize the results of resisted-sprint research, as discussed in our recent Letter to the Editor).
“Imagine a guided bar or an inclined press machine with very high versus very low rail friction, you know you’ll need to adapt loads to provide the same squat stimulus. Same for sleds“
Tweet
For the practitioner, the combination of these two factors can lead to very different overloads/stimuli experienced by the athletes, and accordingly result in misleading training programming (about as misleading as the “everybody squats 80 kg today”, mentioned earlier). This is discussed in detail below, but to provide an example from our recent work: the same relative loading protocol (set at 50% of maximum sled load) could correspond to a load of 69% of BM for one athlete, and 96% of BM for another. If you were to pick a load and change the sled and surface, you could see up to 50% variation in the resistance experienced by the athlete due to changes in friction. This is not something you can ignore/neglect: in the gym, this difference would roughly be a 100 kg versus a 150 kg bar…
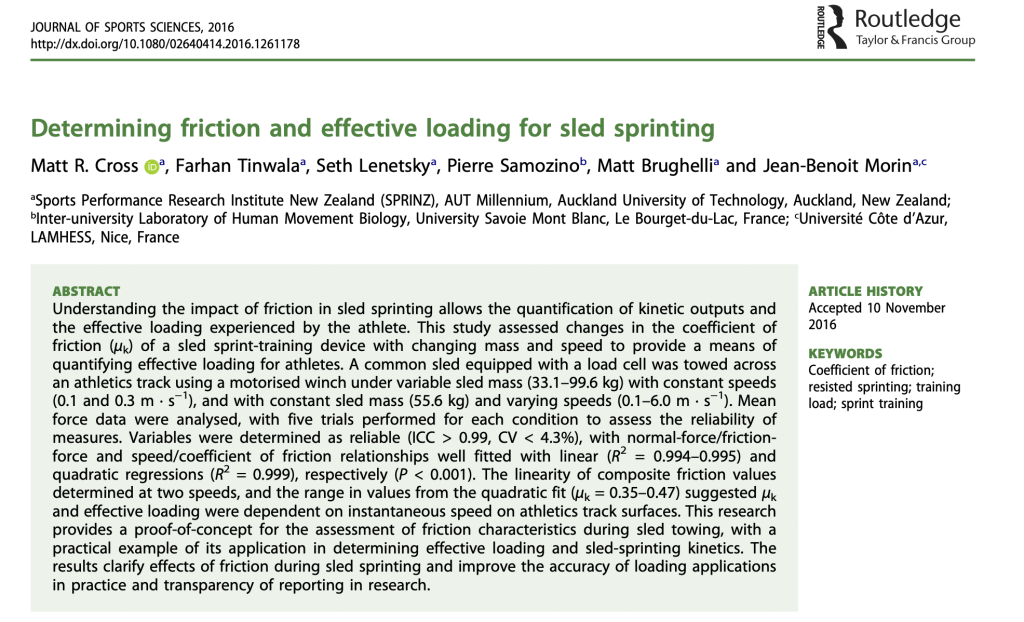
One means of addressing these limitations is creating a “load-velocity profile” for each athlete, and each setting. This blog post and the associated video and spreadsheet will detail how to build and interpret the individual sprint load-velocity profile, based on simple field measurements within a short sprint session. Most arguments are based on our experience, published scientific articles – especially the recent works of Matt Cross and Micheál Cahill.
See the video summary of the protocol used here:
First things first, quantify sled-ground friction
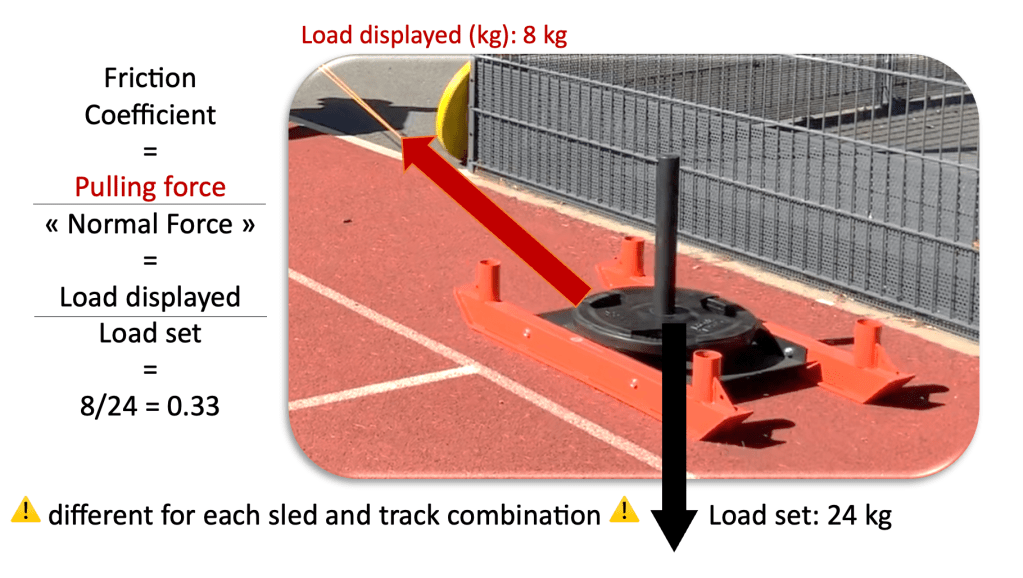
The major difference between a barbell for squatting and a sled for resisted sprinting is that the latter slides across the ground, the former moves through the air. So, if you squat 80 kg, then your system faces an “effective” 80-kg additional load. In the case of resisted sprinting using sleds sliding on the track, the “load” taken as the total mass (sled+additional load on the sled) is not the effective resistance – here, the resistance that will oppose the runners’ propulsive actions. As detailed and illustrated in a previous blog post on the topic, the effective resistive force will be provided in the direction of running through the sled-track friction force. This force is equal to the sled load multiplied by the sled-ground friction coefficient (plus some correction for the angle of pull but no big difference if the tether is long enough). As described in the very detailed study by Matt Cross, the latter ranges around 0.2 to 0.4 for classical sleds on classical tracks. That being said, a different type of sled (paint, type of metal, etc.) on a different type of ground surface (wet, turf, synthetic, grass, etc.) will lead to very different values for this coefficient. Since the friction coefficient is basically the ratio of effective force divided by the load weight (force vector normal to the ground surface), we can simplify things by seeing the friction coefficient as the ratio of the two loads expressed in kg.
To give you a direct example, our sled-track coefficient on the day of testing was 0.33: the load tested (24 kg total sled load) led to a pulling resistive load of 8 kg, so 8/24 = 0.33.
Imagine a different sled and a wet track, leading to a friction coefficient of 0.2. The very same load of 24 kg would have provided a resistive load of 4.8 kg, not 8. At the other end of the loading spectrum, a 100-kg sled would lead to a 33-kg resistive load in one case, 20-kg in the other. So, a same given “sled load” can lead to very different resistive loads, and in turn running velocity and neuromuscular overload and stimulus. Since resistance is generated by friction, you must quantify it, even roughly. Imagine a guided bar on a Smith machine or an inclined press machine with very high versus very low rail friction, you know you’ll need to adapt loads to provide the same squat stimulus. Same for sleds.
“A same given “sled load” can lead to very different resistive loads, and in turn running velocity and neuromuscular overload and stimulus.”
Tweet
Theoretically, this coefficient is the same whatever the load considered, so a multiple-load testing is not necessary (in our example a 30-kg load would have corresponded to a 10-kg resistive load etc.). However, if you want to set a multiple-load test for the coefficient of friction, just plot the linear relationship between sled loads and resistive loads and the slope of this linear relationship is the coefficient of friction.
Finally, the detailed work on the topic by Matt Cross shows that this friction coefficient can change with sliding (thus running) speed, so if the calibration as proposed here is performed at a slow, constant velocity, it may not totally correspond to the entire range of exact sprint speeds during the session. This simple estimate gives a rough but clear idea of the friction coefficient for your testing conditions.
Load-velocity with the Exergenie pulley system
2025 Update !
A Master student and track & field coach, Nayel Constant, has published a testing study on the Exergenie pulley system that you can read here. Many details on force calibration, inter-device comparison, and extending the comparison discussed in this post to a group of athletes.
The main advantage of this system is that you can set very low to very high loads (I could not run at all with most loads) in just a few seconds. Contrary to sleds, resistance is provided solely by a ratcheting braking mechanism that increases friction by gripping a rope (tethered to the individual – ground friction does not apply). So, in theory, you can attach the pulley anywhere, set a load and run without worrying. For those of us who regularly plan high-load sled sessions know it’s a pain to take weight plates to the track, load sleds, change loads, etc. (especially with several players/athletes), the unit fits in a small carry bag!
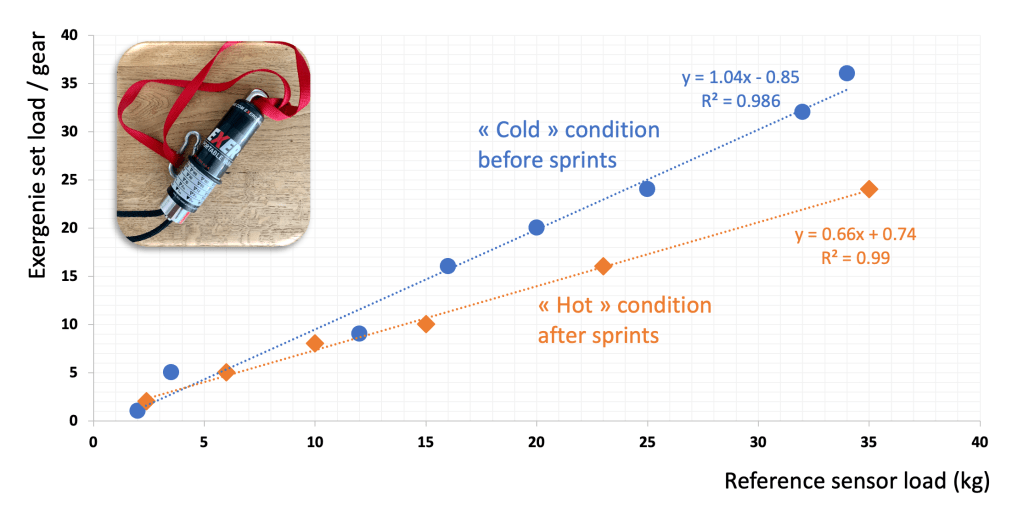
Nevertheless, despite its promise, it is not a given that the ratchetting system provides a predictable increase in resistance (e.g., 1 increase in the ratchet could add a different magnitude of resistance from the previous setting or to the next). Thus, I wanted to “calibrate” it, to know what resistive load was applied as a function of the load set by the different gears of the device. To do so, I used exactly the same procedure as with the sled: pulling at constant speed for different loads, and reading the crane scale display. Same issue as for the sleds, I did not use different speeds (only about 1 m/s) so further testing is planned to have a more detailed view of things. In addition, I performed the very same type of testing after the sprint session, with a “hot” device, after the rope had passed through the pulley system for about 200 m in total (all my sprint trials) at high speeds.
The results of this preliminary testing (illustrated below) show (i) a linear relationship between set and measured loads, but loads seem to correspond to kg rather than lbs and (ii) that this relationship differs between “cold” and “hot” conditions (you really feel the device and internals heat up after a couple of sprints). These results need more detailed testing and confirmation, but a practical application is that the pulley can be confidently used to provide a well-controlled resistive force—even if direct speed feedback is preferable to account for the change in friction during a session. The time course of this hotness is not known but this warrants a few warm-up runs and if possible to check the associated speed to fine-tune the load setting for the desired stimulus. Finally, the system I used was brand new and I do not know the extent to which the data obtained here may differ after several sessions, a dirty/wet/worn rope, and internal changes. For now, my opinion is that the Exergenie pulley system has a very interesting ease-of-use/loading accuracy ratio. Especially if you cannot easily access or travel with sled and loads. Thanks to my collaboration with the French elite physical coaches in tennis, I realized that despite the interest in programming a high resistance acceleration session, it’s not always easy – this technology is promising in addressing that fact. Not to mention the overall cost of a sled plus 60-120 kg additional loads. Quickly accommodating resistance is the key Exergenie feature which allows for easy load adjustment at any angle or position (see video example here: https://www.instagram.com/p/BBBIPMpkbvl/).
Sprint trials and the load-velocity relationship
A basic tenet of resistance training is that the heavier the load we try to move (under maximal intent, and as fast as possible), the slower the overall motion generated. Nothing new. This is well known for many gym-based exercises and is the basis for “velocity-based training”. Simply, movement velocity should be the focus of assessment and programming, and applying load is just the tool we use to target those conditions. Read this recent paper on the topic for more information. Resisted sprints follow the exact same principle, even if things are a little more complex than a ‘simple’ single- or multiple-joint exercise such as the bench press or squat since the entire body moves at a speed that is linearly decreasing as a function of increasing loads.
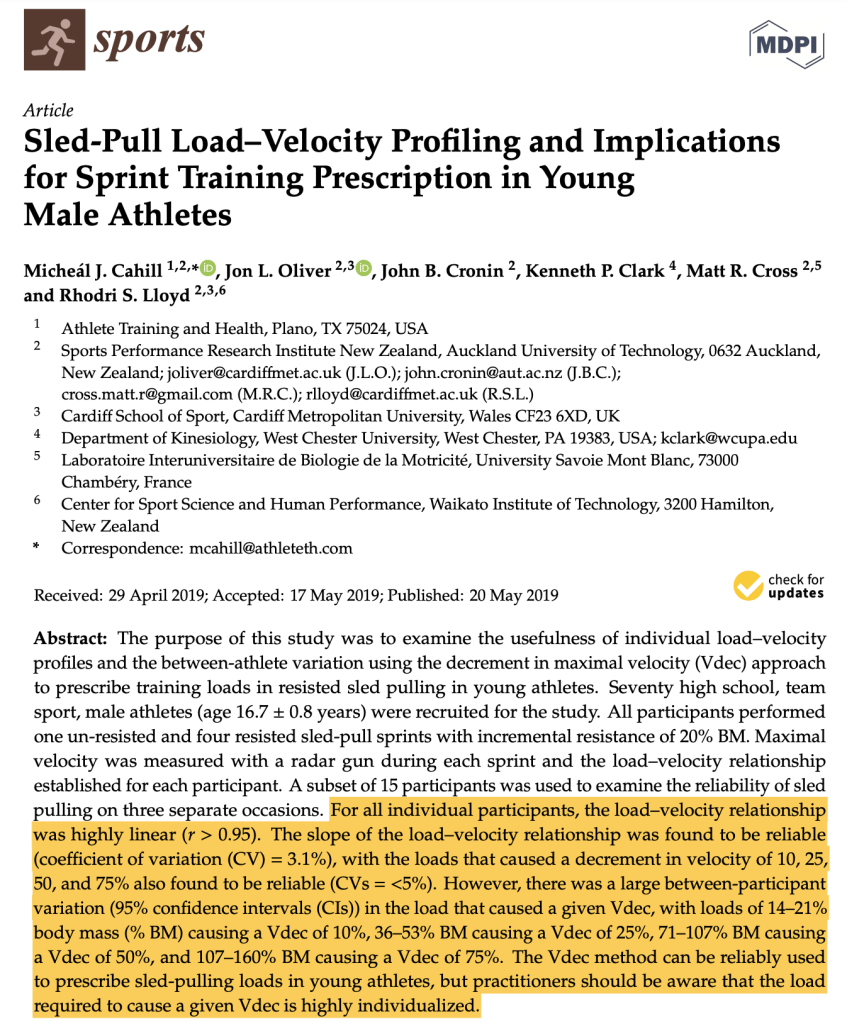
As for gym-based S&C exercises, the important piece of information is that this load-velocity relationship is highly individual, and if all athletes more or less move their “1RM” load at the same velocity (that 1RM load being possibly very different between individuals), the slope of the linear load-velocity relationship is individual. This has been observed and studied in detail in this paper by Matt Cross and this one by Micheál Cahill. Notably, the highly individualized nature of the profile justifies assessing and programming resisted sprinting based on velocity decrease from the individual’s maximal value (%vDec) rather than absolute kilograms or percent body mass. To read details on these important points see this series of blog posts and review of literature by George Petrakos. An example of this approach has been used by Cameron Josse with football players to set and train at the individual load associated with a 50%Vdec. See Cameron’s detailed blog post and case study here.
Using this free spreadsheet, and the Gpexe Pro2 GPS unit (18 Hz) to provide my running velocity, I performed one maximal unloaded 30-m sprint (to reach my top speed) and four loaded sprints (25 to 55 kg sled loads). The load-velocity obtained was quasi-linear and the quality of points alignment (linear regression coefficient close to 1) showed a good quality of testing and especially the maximal intention.
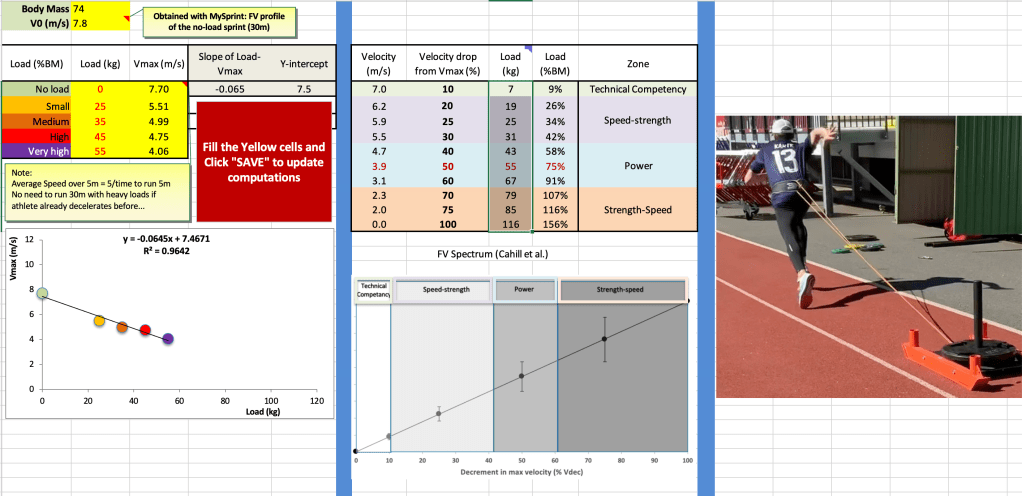
The range of maximal running speed went from 7.7 m/s during my unloaded sprint (hey sorry, I’m a Masters triathlete and trail runner now…) to 4.06 m/s against the 55 kg sled (i.e. a resistive load of 18 kg in the conditions of the test). I could have tried with a heavier sled (e.g. 65 or 70 kg) to have one more point on the right side of the relationship but this additional effort was not planned due to the almost perfectly linear relationship within the load range tested.
Based on the linear equation fitting my load-velocity relationship, I can then compute the load corresponding to any %vDec value. The central table shows the loads range for each 10 %vDec over the entire spectrum: from 10%Vdec (very small decrease in running velocity, 7-kg load in my case for these conditions) to 100 %vDec (the load I theoretically could not move, 116-kg sled in my case for these conditions). The latter can be considered—again, in these sled-ground conditions—as my “sprint 1RM” or L0 as initially described by Matt Cross in our 2017 study. In fact, to be more correct conceptually, my “sprint 1RM” would be a bit lower, since 1RM represents a load you can actually move; rather, here the load is more a ‘theoretical’ max.
Then, as detailed in the central table above and this paper by Micheál Cahill, the range of loads displayed will allow coaches and athletes to set the correct load for the correct stimulus and overload targeted. The categories proposed by Micheál Cahill make sense to me and correspond to many coaches’ practice: from “technical competency” to “speed-strength”, “power”, and the heavier-slower part of the spectrum “strength-speed”. For example, if I want to improve my maximal propulsion power as shown in several training studies, I will program resisted sprints at the load associated to my 50 %vDec: here, for me, 55 kg or 75% body mass. The same stimulus will very likely be obtained with a different load for an athlete with different capabilities. This can also be the basis of a “phase-specific” training approach, in which each specific phase of the acceleration spectrum (from 0 to top speed) can be individually matched with a load or resistance condition that induces for the individual considered, the same running speed zone. For instance, high loads correspond to early acceleration, etc.
This post is focused on methodology, not on training programming, but several intervention studies have been published to better understand the “dose-response” effects of training each part of the load spectrum on the sprint acceleration performance and force-velocity outputs. The following two studies (by Micheál Cahill in 2019 and by Johan Lahti in 2020) are, in my opinion, some of the most illustrative ones on the topic. The study by Cahill et al. shows in young athletes that the training effect (i.e., change in the force-velocity profile and sprint performance during acceleration) depends on where along the load-velocity spectrum you target during training. The study by Lahti et al. (confirmed by another one in elite rugby players) shows that the training effect depends on the players’ initial force-velocity profile. These two results and accumulated evidence from experienced coaches support the need to individually profile, and program resistance training for sprint acceleration performance.
For a complete and detailed article on the importance of setting resistance accurately and individually, and correctly quantifying force output during resisted sprints, make sure you read this piece of work by Matt Cross:
Comparison between resistance systems
The final part of this post aims at studying the correspondence between the two resistance systems used – sleds and the Exergenie. To ensure the trials for each trial and system were maximal intensity (i.e. no significant order/fatigue effect), I only did one trial per load, with enough recovery. That is, 9 sprints in total, each <30 m. To compare the data, I plotted the load-velocity relationship obtained with each device using the spreadsheet, and then extracted the ‘load’ (gear setting or normal load, for Exergenie and sled, respectively) that corresponded to a variety of %vDec settings across the spectrum. I then compared these using correlation, allowing the load setting for each device (again, for these track conditions) to be estimated for any given %vDec:
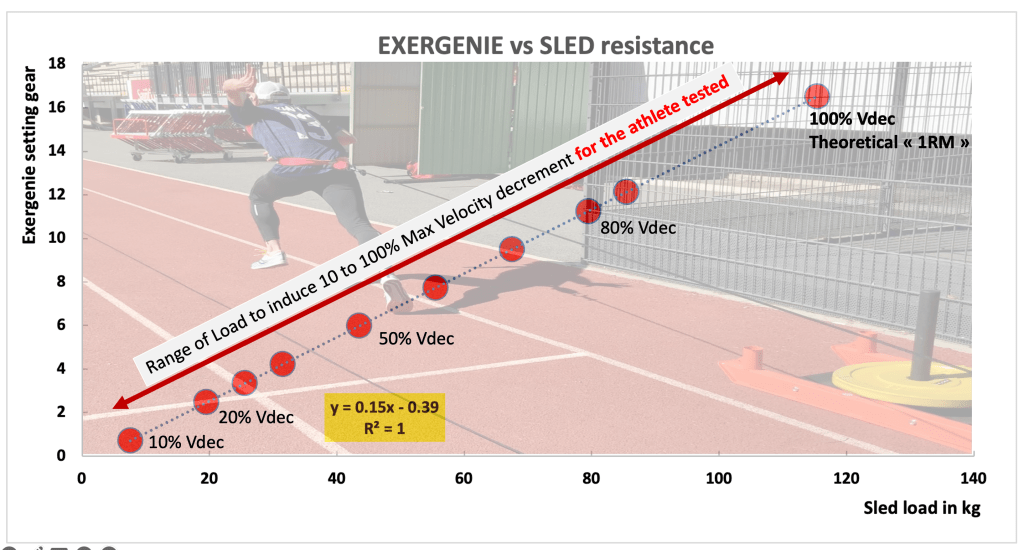
The main conclusion, keeping in mind the aforementioned limitations associated to this preliminary study context (n=1 participant, pretty low top speed, single velocity testing for devices friction calibration), is that the two systems induced overloads that were almost perfectly correlated. In other words, my load-velocity relationships obtained with the sled and with the Exergenie were parallel and the data of %vDec proportional. The regression equation shown in the figure gives the “conversion key” to estimate, in my case, for the testing conditions used, the load correspondence between the systems. For example, the sled 55 kg associated with my 50% vDec would correspond to an Exergenie setting of approximately 6. This is interesting as it tends to suggest that both systems can be considered valid to provide a wide range of loads and build a consistent load-velocity relationship. Another point to be confirmed is the degree of intra-athlete reliability of the load-velocity relationship, even if we can be confident given the results observed in published research.
“In both research and practice the way resisted sprint loads are regularly prescribed is still years behind the gym-based approach”
Tweet
In summary, the load-velocity relationship is a potentially powerful tool for resisted sprinting training prescription, and there are many ways to build it. However, it is incredibly important to do it properly and avoid mistakes in training prescription, or research protocols design. The take-home message is that there are many ways to assess velocity (all with positives and negatives for low to high budget, eg MySprint app to Laser or GPS systems), and several to apply loading. Weights/sleds are fine if you have them, expensive if not, but quite impractical to move around (and suffer from potential friction issues). The Exergenie is a promising means of providing a similar targetable stimulus in a much more portable manner, and potentially without the same limitations. However, further studies are needed to describe the loading options and their consistency more comprehensively within and between sessions and athletes.
Beyond the measuring technologies and loading/training technologies used here as examples, this post provides preliminary data, guidelines and a free spreadsheet to do build, study and use the individual sprint load-velocity relationship with potentially any combination of accurate speed and load measurement systems.
Acknowledgements
I thank my daughter for helping me film and edit the videos, Matt Cross for his comments on the draft article, Jonas Dodoo and Speedworks for the Exergenie system, and Jim Warren from Exergenie for his comments. This blog post is not a scientific study and results must be interpreted with caution before further studies are planned and published.
References
Balsalobre-Fernández C, Torres-Ronda L. The Implementation of Velocity-Based Training Paradigm for Team Sports: Framework, Technologies, Practical Recommendations and Challenges. Sports (Basel). 2021;9(4):47.
Cahill MJ, Oliver JL, Cronin JB, Clark KP, Cross MR, Lloyd RS. Sled-Pull Load-Velocity Profiling and Implications for Sprint Training Prescription in Young Male Athletes. Sports (Basel). 2019 May 20;7(5):119.
Cahill MJ, Oliver JL, Cronin JB, et al. Influence of Resisted Sled-Pull Training on the Sprint Force-Velocity Profile of Male High-School Athletes. J Strength Cond Res. 2020;34(10):2751-2759.
Cross MR, Brughelli M, Samozino P, Brown SR, Morin JB. Optimal Loading for Maximizing Power During Sled-Resisted Sprinting. Int J Sports Physiol Perform. 2017;12(8):1069-1077.
Cross MR, Samozino P, Brown SR, Lahti J, Jimenez-Reyes P, Morin JB. Comment on: “The Effectiveness of Resisted Sled Training (RST) for Sprint Performance: A Systematic Review and Meta-analysis”. Sports Med. 2019;49(2):349-351.
Cross MR, Tinwala F, Lenetsky S, Samozino P, Brughelli M, Morin JB. Determining friction and effective loading for sled sprinting. J Sports Sci. 2017;35(22):2198-2203.
Cross MR, Tinwala F, Lenetsky S, et al. Assessing Horizontal Force Production in Resisted Sprinting: Computation and Practical Interpretation. Int J Sports Physiol Perform. 2019;14(5):689-693.
Lahti J, Huuhka T, Romero V, Bezodis I, Morin JB, Häkkinen K. Changes in sprint performance and sagittal plane kinematics after heavy resisted sprint training in professional soccer players. PeerJ. 2020;8:e10507. Published 2020 Dec 15.
Lahti J, Jiménez-Reyes P, Cross MR, et al. Individual Sprint Force-Velocity Profile Adaptations to In-Season Assisted and Resisted Velocity-Based Training in Professional Rugby. Sports (Basel). 2020;8(5):74. Published 2020 May 25.
Petrakos G, Morin JB, Egan B. Resisted Sled Sprint Training to Improve Sprint Performance: A Systematic Review. Sports Med. 2016;46(3):381-400.

3 thoughts on “SPRINT « VELOCITY-BASED TRAINING »: IT ALL STARTS WITH INDIVIDUAL LOAD-VELOCITY PROFILING”