Written with the precious help of Drs Matt Cross and Pierre Samozino (and without ChatGPT)
Sometimes it is important to spend time and energy on breaching Brandolini’s bullshit asymmetry principle…
The idea for this post came after a question from one of our PhD students at a Journal Club session: “JB, I use the (cycling) force-velocity profile in my thesis work and I saw recent criticism on Twitter and a Letter to the Editor saying it was flawed. What if one of my Jury members is arguing against the use of this approach? Could you comment on these recent criticisms to clarify things?”.
I found it very interesting to potentially clarify things on the topic, with sound arguments. But on second thought, this comment highlights a deeper problematic trend: a couple of unsupported tweets, and a poorly written Letter to the Editor focusing on terminology, may be considered credible evidence in a “controversial topic” – in this case, one with decades of research published by several independent groups using reference methods.
Today’s confusion between social media and science is concerning. Two tweets by scholars with no record on a topic can be considered a basis to challenge dozens of consistent papers. “2 plus 2 equals 5”: you disagree, ok we have a debate. If these arguments remained in Twitter-now-X space it would be one thing (for all its positives, it is not typically known as a medium of reason…). However, the concerns voiced by this PhD student signal a worrying occurrence: these largely anecdotal remarks appear to be bleeding into places they don’t necessarily belong without first undergoing rigorous examination. Based on my anecdotal experiences as an author, reviewer, and Editor, I see increasing number of comments based on tweets only (no reference, no data): “this author said on Twitter that….”, “this method was recently criticized: http//instagram……”
Of course, at its best science is about replication and refutation, and hypotheses regarding flaws in a paper, method, or approach, are certainly not beholden to published academics nor even the academic space (a fact is a fact, regardless of who says it, or the intent behind it). However, to be taken seriously, an argument should be sound, based on extensive analysis and synthesis of the literature. As we will see below, in the case of FV approaches, this includes works from single-muscles to complicated multi-joint movements, from jumping to bench press throws and sprint kayaking accelerations and using a variety of technology from cellphones to force-plates to GPS.
Arthur Schopenhauer proposed that “All truth passes through three stages. First, it is ridiculed. Second, it is violently opposed. Third, it is accepted as being self-evident.” After almost one century of research on the topic, the “force-velocity” relationships seem to pass through these stages cyclically, again and again.
The aim of this post is to explain, based on reference methods and studies by independent research groups, the basics of “force-velocity” analyses in multi-joint human movement. Hopefully, this will help readers distinguish recurrent reactionary and unsupported rants from the massive amount of sound “force-velocity” studies published since the 1920’s.
The bottom line: we all agree that when acting with maximal voluntary intent (thus intensity) our body cannot produce as much force against a light load (and so accelerating it much more) than against a heavy load. The higher the velocity (due to the lower load during a maximal effort), the lower the maximum force production, and vice-versa. This is the force-velocity relationship. Yes, there is a force-velocity relationship, and since it varies between individuals (expression of different force outputs for a given load, thus velocity condition) we sometimes describe it as a “profile”: the FV profile. Once we agree on that, everything else is about measurement accuracy, best/preferable mathematical description of the phenomenon, and squabbles about terminology and applications and who came up with the ‘idea’ first.
Yes, there is a force-velocity relationship, and since it varies between individuals (expression of different force outputs for a given load, thus velocity condition) we sometimes describe it as a “profile”: the FV profile.
Tweet
A.V. Hill’s seminal works: a century-old basis
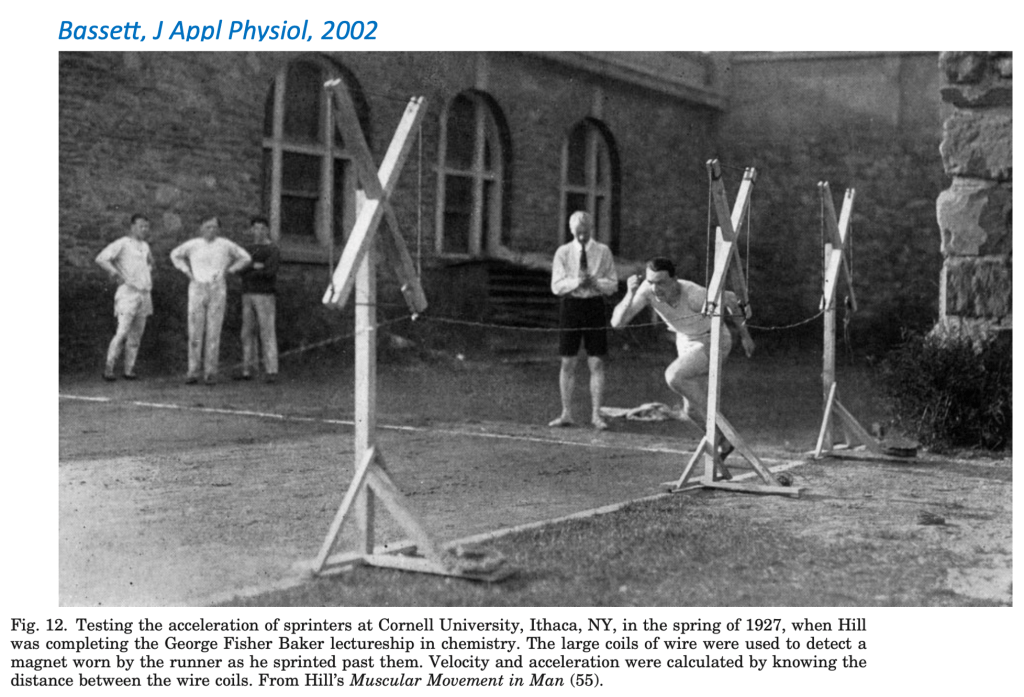
At a time when “physiology” and “biomechanics” were not classified as different branches of “biology”, the aim of Nobel Prize laureate Archibald V Hill was to better understand the relationships between muscle function and movement, performance, energy consumption/production, and locomotion. In a wonderful historical perspective work, Bassett (2002) mentions these works during which “field” and “lab” were the same place, and AV Hill was estimating sprinters force output and mechanical work based on position-time measurements (described in the sprint section of this piece). My favorite science picture below, presents the exact same setting as the one used in the 2020’s with the method presented by Pierre Samozino and colleagues (read here). Same approach, same maths (exponential fitting of the position-time or running speed-time data), different devices.
To summarize Hill’s works on the topic briefly (and imperfectly), he described both muscle fiber and isolated muscle contraction velocity as a function of tension or force exerted (isolated conditions) and the work (or force in standardized actions) produced as a function of joint action velocity (single joint movements). In the isolated conditions (fibers or muscles stimulated and this working out of the body), he observed the famous hyperbolic-type FV relationships. However, what is often overlooked is that during in vivo “real life” movements such as elbow flexion, the relationships described between “work” and velocity are much closer to a linear trend than a hyperbolic one. Should the exercise be performed over a constant range of motion, force output can be computed from mechanical work in the pulling action, which leads to linear FV curves as described below:
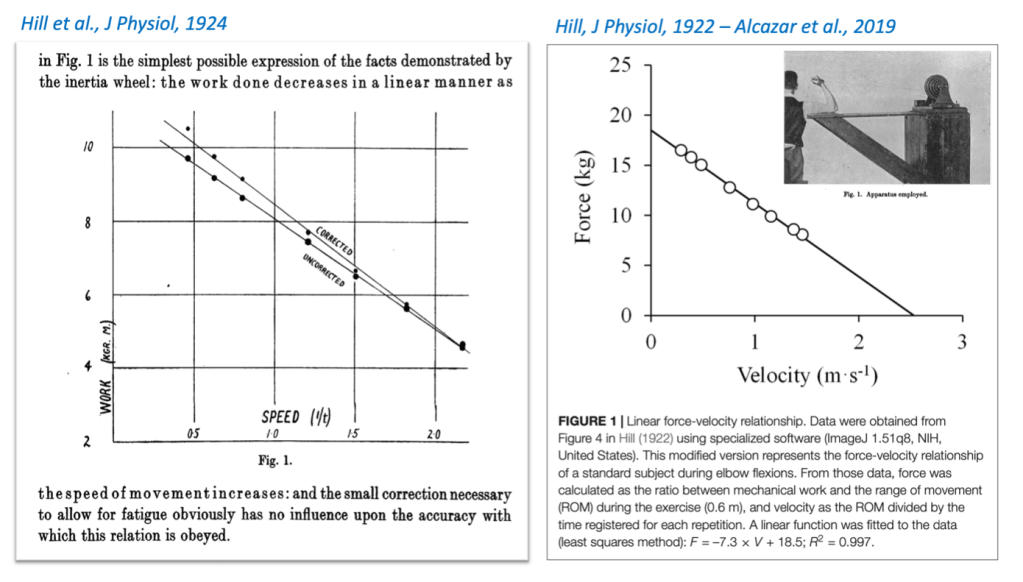
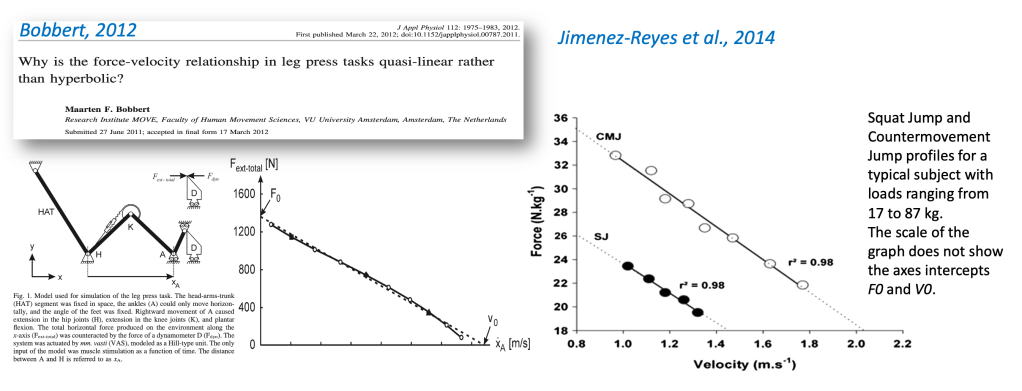
A 2019 review by Alcazar et al. discussed this historical “debate” around the actual shape of the FV curve. What most people don’t get is that there is not one shape of one FV curve. There are different shapes for different FV curves, depending on the type of physiological and mechanical conditions considered. From hyperbolic to linear as the conditions range from in vitro (artificially max-stimulated) single, isolated muscle fiber to in vivo (including neural drive mechanisms) multi-joint global tasks like pushing, pulling, extending the limbs… and performing strength and conditioning or sports tasks. Importantly: the FV curve is not hyperbolic, OR quasi-hyperbolic, OR quasi-linear, OR linear. It all depends on the task and context you’re referring to, resulting in different biomechanical or physiological mechanisms involved in the force production. This was also discussed in a 2012 paper by Bobbert, titled “Why is the force-velocity relationship in leg press tasks quasi-linear rather than hyperbolic?”
As in Hill’s seminal works, and as we’ll explore below, most dynamic movements follow quasi-linear FV relationships and characterize individuals’ FV “profile”. Note that since purely linear (R2 = 1) FV shapes are never observed, we’ll often simplify the reading by naming some potentially “quasi-linear” relationships, “linear”. Of course, it is interesting to know whether “quasi-linear” is a better term than “linear”. However, we shouldn’t lose sight of our goal here – for applied sports scientists it is far more important and ultimately useful to understand how these FV curves can be best obtained, and why they are helpful to better understand force production capacities within human movement and performance. In other words, let’s look at the moon, not the finger.
Frankly, let’s not lose time discussing whether a 0.97 regression coefficient is “not linear” but a 0.98 one is, while ignoring the bigger picture and the potential practical utility of each.
Tweet
For those interested in falling down the rabbit hole on that specific topic, an open-access manuscript published this summer explores this issue in details (read Riviere et al.’s paper here).
In the following sections I discuss the most frequently studied all-out exercises: cycling, lower-limb acyclic extension (squatting, vertical jumping, leg pressing etc.) and sprint running. I will mainly focus on reference methods (lab dynamometers and force sensors) but also comment on the validation of corresponding field methods where possible. I will try to summarize the observations about (i) the quasi-linearity of the FV curve and (ii) the possibility of extrapolating this FV curve to explore the theoretical maximal force and velocity capabilities, and the associate risk of variability and error.
For a published review, I recommend the 2015 paper by the late Slobodan Jaric et al. “Force-velocity relationship of muscles performing multi- joint maximum performance tasks” (read here), and the 2017 review by Matt Cross on sprinting (read here).
Sprint cycling
My first indexed Journal paper, in 2004, included some sprint cycling tests, where for each pedal downstroke angular velocity can be plotted against the torque measured around the crank arm rotation axis. Note that the “effective force” (i.e., the component that will eventually drive the wheel) represents the component applied perpendicular to the crank axis. When considering the force acting on the wheel and the linear displacement induced, these “torque-angular velocity” relationships can be directly expressed as FV relationships. I won’t list them all here (see review by Driss and Vandewale and the reference study by Dorel et al.) but I guess there are 20+ studies, from 5+ independent research groups, consistently showing linear (ok quasi-linear…) FV curves, per the images below.
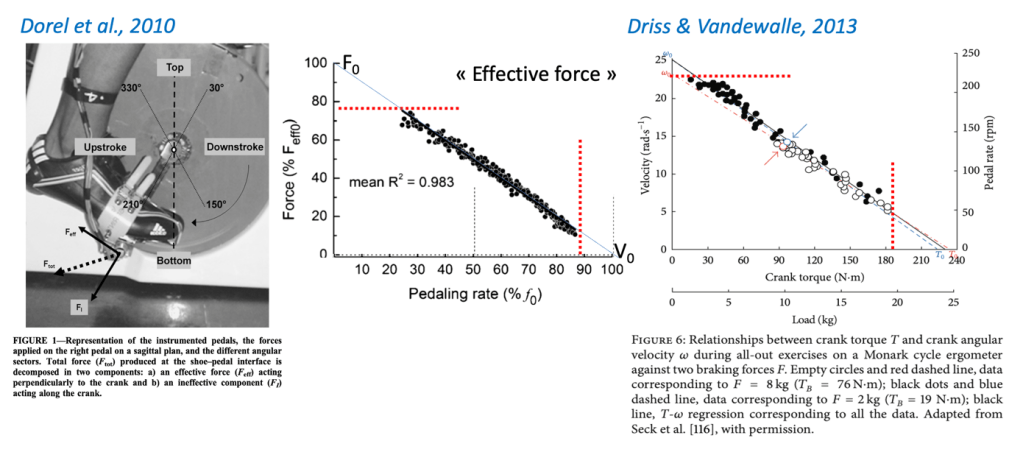
In these examples, as in many of our observations and cited studies, the maximal pedaling “velocity” actually measured is about 90% of the theoretical maximal value V0 (i.e., the x-axis intercept of the FV curve) and the maximal effective force output actually measured is about 80% of the theoretical one F0. Why extrapolate to obtain these theoretical values? Estimating the “extra” 10-20% force and velocity output inaccessible during the test allows us to describe the theoretical maximal capacities of the athlete’s neuromuscular system in isolation from potentially confounding factors. These could have been reached, should the experimental conditions (friction, inertia, coordination…) allow, and they will represent the limits of the individual’s system in the task considered. In other words, force production capacity trends to F0 when velocity trends to zero and trends to zero when velocity trends to V0. Finally, note that in this example, the 14 participants FV profiles were very different in terms of F0 and V0, but plotting normalized values allows us to scale the data and directly overlay profiles.
Note that, contrary to the seminal works of AV Hill that used a “multiple trial” approach, here each single pedal downstroke is considered as a maximal effort, and the FV relationship is obtained from a single sprint. Basically, in the former approach, force production is estimated at a range of constant velocities across different trials (historically due to technology limiting sample granularity) by manipulating the braking/loading applied. The resulting data from all trials are compiled into a quasi-linear relationship of increased output against heavier loads (and thus lower velocities). In the latter approach, the force production necessary to overcome inertia and accelerate the flywheel is measured during each recurrent pedal stroke, which subsequently decreases quasi-linearly as movement velocity increases. That said, several works have also consistently shown a quasi-linear relationship between friction load and maximal velocity output in a “multiple load” approach of sprint cycling FV relationships, and when accounting for factors like fatigue the two approaches are comparable. This is, of course, logical since they both detect force production capacity at different velocities within the same technical movement pattern.
Sprint running
In running, the external force output considered will be, as for cycling, the component of the ground reaction force that has the same direction as the center of mass macroscopic displacement and velocity over time. Although the center of mass moves in all three dimensions of space during a “linear” sprint, the main direction of interest is that of the finish line: the antero-posterior (forward) direction. Thus, as for cycling, running sprint “FV profiles” will be studied via the relationship between the forward displacement velocity of the athlete (their center of mass) and the component of the ground reaction force acting in the same direction: the antero-posterior (horizontal) component. This analysis was first mentioned in studies from the 1920’s: Furusawa, Hill (yes, him again) & Parkinson, and Best & Partridge. As we’ll see below, since they could not directly measure the force output, they estimated kinetics by applying Newton’s laws of motion to the runner’s center of mass and measurements of running velocity over time.
Be it Hill’s team in the 1920’s, or our works in the last decade, sprinting FV relationship has never aimed to indirectly estimate isolated muscle force production, but just to characterize an athlete’s macroscopic force production capacities during the task of sprint acceleration.
Tweet
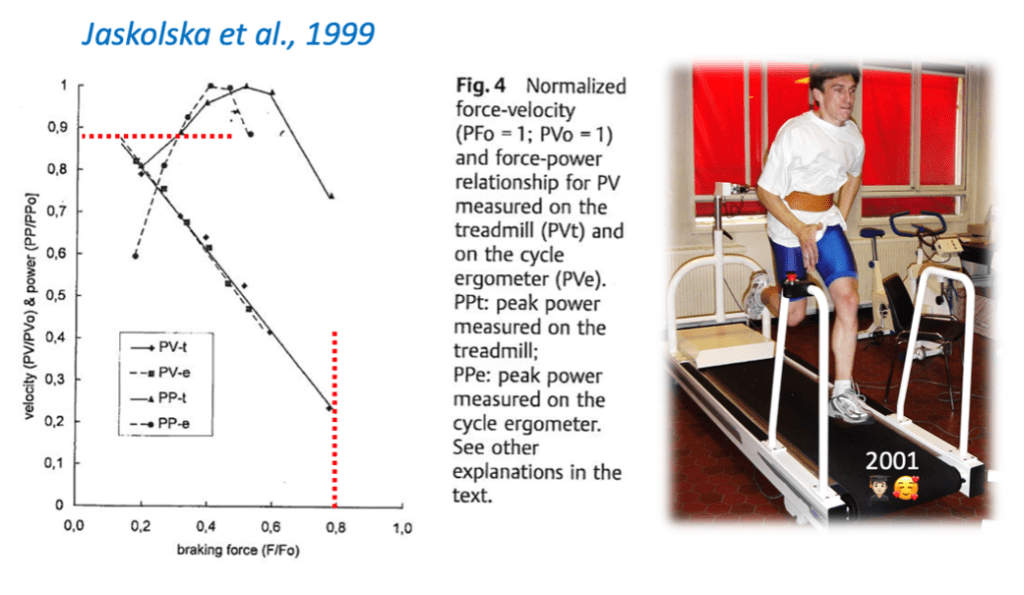
One of the first attempts to study the sprint FV relationships used an instrumented treadmill and the multiple-trial approach. Interestingly, in this 1999 paper, Jaskolska et al. show the comparison between normalized FV profiles on the cycle ergometer and the instrumented treadmill I used during my Master’s degree (Yeah, I’ve been in this game for 20 years). The Figure below shows that (i) normalized FV profiles are close to linear for the two modalities for male physical education students and (ii) despite the inertia and limitations of the motorized treadmill, about 80% and 85% of the theoretical maximal force and velocity outputs could be reached experimentally; leaving again very little space for erroneous extrapolations.
Although instrumented treadmills accelerated sprint-mechanics knowledge, the use of track-embedded force plates was a huge and necessary move to map these findings on to “real life” sprinting. The first attempts were published in Italy by the great Cavagna in 1971. The first FV relationship was published in a study by Rabita et al. in 2015 and commended by an Editorial authored by Clark and Weyand: “Sprint running research speeds up: A first look at the mechanics of elite acceleration”. In short, we again observed linear individual FV profiles. Moreover, again measured data were close to 90% of theoretical F0 and V0 (when including starting-blocks values of antero-posterior force component). Note a potential limitation of this work was that relationships were drawn from compiling data collected during different trials, due to the limited length of the instrumented track section allowing a limited window of collection (i.e., about 8 meters). Nevertheless, replication work has somewhat alleviated potential concerns, as I discuss below.
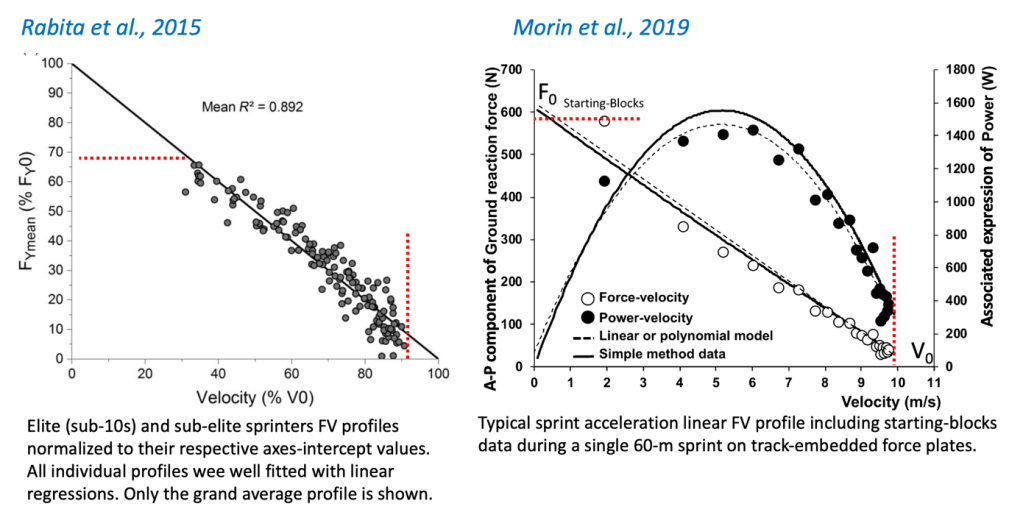
The final chapter (basically confirming all previous ones) of this sprint FV journey was made possible by the advent of a fully instrumented sprinting track in Japan, presented in 2017 by leading sprint mechanics researcher, Ryu Nagahara. Using this unique “device” we replicated our 2016 study but this time exploring sprint FV profiles over single efforts. For each stance phase, the center of mass velocity in the forward direction of motion was plotted against the corresponding component of the ground reaction force. Et voilà. Force-Velocity relationships were all highly “quasi-linear” (average R2 of 0.96) and as shown in the typical example above, the experimental measurements of maximal force output and velocity in the overall direction of motion were (including starting-blocks) above 95% of F0 and V0. An informed observer could note that the point corresponding to the starting blocks push is quite above the FV regression in this example: this is not the sign of a potential curvilinear FV curve here, but rather the fact that block push does not present the same running pattern as the subsequent steps and offers a technological way to “amplify” horizontal force. Anyway, the wide range over which the FV curve was observed means that extrapolating actual measurements to estimate and discuss “theoretical maximal capabilities” of forward running speed (V0) and associated force (F0) production in sprinting is not a giant leap and risk of error.
Given the interest in better understanding athlete mechanical outputs and indirectly neuromuscular capabilities underpinning sprint performance, Samozino et al. proposed a macroscopic computation method to estimate the net step-averaged horizontal component of the GRF (i.e., per the above, the ‘effective proportion’ applied in the running direction) and the associated “quasi-power” over time during a sprint acceleration (i.e. the mechanical energy production rate associated to the horizontal component of the GRF). This method is based on the almost 100-year-old consistent observation that position over time (or running speed over time) follows a simple mathematical model. Athletes maximally accelerate from 0 to their top speed following an exponential model (see previous blog post) – this model applies to 5-year-old kids to 90+ master athletes, and from recreational individuals to team sport players (including on-ice hockey accelerations) and even to the World Record race of Usain Bolt. Once the position or speed data are fitted with this model, the step-averaged force output over time in the horizontal direction can be computed based on Newton’s laws of motion and air friction estimates. Despite obvious limitations such as the lack of step-by-step analysis and the need for a complete linear sprint acceleration, this method has been validated against reference force plate measurements in both a repeated sprint protocol (Samozino et al.’s study in 2016, read here) and a single sprint protocol using the unique 60-m force plate system at Nagahara’s lab in Japan (our study in 2019, read here). As shown in the Figure, the FV profile in sprinting assessed with this “running kinematics” based method is linear (as with force plates) and the F0 and V0 extrapolations are very close to the maximal horizontal force and running velocity measured, respectively.
Subsequently, this method has applied to many different types of position or speed measurements (1080 Sprint machine, radar, laser, timing gates, MySprint app, GPS, LPS) and across different sports (rugby, football, athletics, basketball, on-ice hockey accelerations) in various published or in-review studies. Here again, the quality of the input measurements (position or speed over time) directly influences the quality of the outputs. For example, a GPS study performed a few years ago before the advent of more recent (and accurate) devices showed poor concurrent validity of 5 Hz units (better with 20 Hz devices) compared to radar or laser devices taken as references. For a comprehensive review on the topic (that does not include the 2019 step for obvious reasons) please see Cross et al.’s 2017 paper, and for a recent multi-device comparison, see Fornasier-Santos et al.’s recent paper here.
Lower limb acyclic extensions: leg-press, squat and vertical jumps
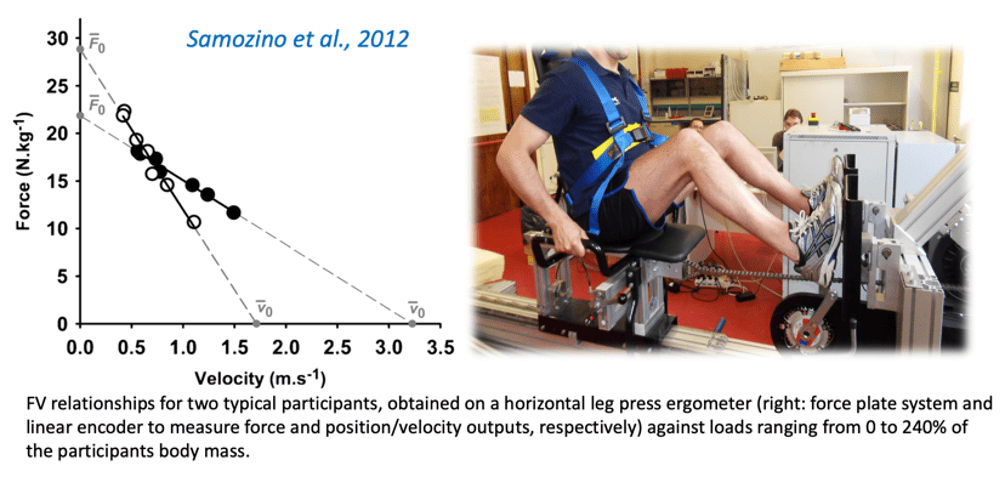
As for the running or cycling exercises, performing all-out ballistic lower limbs extensions under different loads (from unloaded to very high load conditions) will lead to extension-averaged force and velocity outputs that overall represent a strong quasi-linear relationship. This type of linear FV relationship has been observed in leg-press conditions, and in vertical pushes during squat or countermovement jumps protocols. The typical reference measurements are made with force-plate systems for the force output and linear encoders, or computations derived from the force data, for the velocity output.
Despite several studies from independent research groups showing the very high linearity and the reliability of the profile in leg press exercises and vertically-oriented pushes like squat, jump squat or countermovement jump using reference force plate systems (eg Rahmani et al. 2001, Samozino et al. 2012, Yamauchi and Ishii 2007, Bobbert 2012, Zivkovic et al. 2017, Cuk et al., 2014; Feeney et al. 2016; Giroux et al. 2015; Meylan et al., 2015; Garcia-Ramos et al. 2019) debate persists on the linearity of the FV profile up to the extreme values (axes intercepts F0 and V0). The points of discussion are well detailed in the papers of Alcazar et al. and Bobbert. The latter used biomechanical modeling of a leg-press movement to discuss the different types of FV behavior depending on the level of analysis (isolated muscle to multijoint tasks) and produced an example of quasilinear FV relationship from F0 to V0 displayed below.
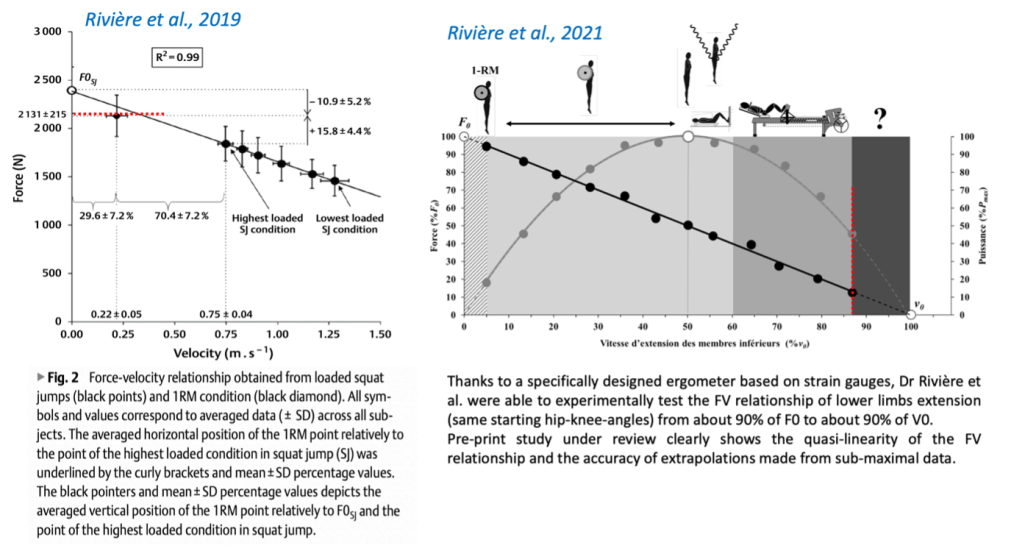
To assess this linearity and the accuracy of such extrapolated theoretical values of lower limbs extension force and velocity, direct experimental studies have been performed with conditions that allowed participants to perform as close as possible to their F0 and V0. Rivière et al. showed that the 1RM squat force-velocity point was quite aligned with other submaximal points of the individual FV relationship. The same group also explored the velocity extrema of the relationship and showed experimental values of lower limb extension close to 90% of V0 (Rivière et al. 2023, open access paper to read here).
Taken together, these results support a quasi-linearity of the ballistic lower limb extension FV profile from about 90% F0 to about 90% V0.
Tweet
As with sprinting, Samozino et al., proposed in 2008 a simple method to estimate force output based on jump height and push-off distance measurements (read here). This method allows the computation of push-off average values of lower-limb force and velocity. Subsequently, when implementing this ‘simple method’ across multiple loading conditions the data can be combined to draw an FV relationship. This method is based on a macroscopic analysis of the mechanical work produced during push-off, and was validated initially against force plate measurements; this validity has been confirmed by other studies: Giroux et al. (force plate reference), Palmieri et al. (3D video analysis and inverse dynamics), Janicijevic et al. and Garcia-Ramos et al. (force plate reference), and Jimenez-Reyes et al. for countermovement jump (force plate reference).
Exactly as for the sprinting method described above, variability in the inputs (jump height, push-off distance) over the different loading conditions will inevitably generate variability in the outputs (eg slope of the FV relationship, F0 and V0). A lack a standardization of testing conditions could have even more negative consequences when using a computation method in which some variables (such as the distance of push-off hpo) are determined a priori.
So, what’s the problem?
The latter point is the problem: recent works and discussions clearly show a confusion between unreliable data/results and unreliable method/concepts. Recent studies (Valenzuela et al. 2021, Lindberg et al. 2021, Kotani et al. 2022) have challenged the reliability and subsequent utility of the concept of “FV profiling”, with little to no consideration in their conclusion of other obvious sources of poor reliability. In each case, input data were obtained from jumping measurements which themselves appear unreliable and poorly standardized, considering the raw data available. Are FV relationships and associated individual “profile” concepts fundamentally flawed (as commented on social media), the associated testing methods unreliable (as often concluded in these studies), or is it in fact (and to what extent) an issue with the input data measurements?
These recent studies have reported poor reliability of FV profile outputs (notably V0 and the FV slope) obtained during jumping using various methods, including computation-based and reference methods. The interpretations and conclusions provided by the authors clearly challenge both the methods and the FV concept relevance: “The squat jump FV […] profiles established with a force plate are not reliable. Therefore, these profiles are not recommended to be used to inform programming decisions”,and “Coaches and researchers should be aware of the poor reliability of the FV-variables obtained from vertical jumping”, or “FV variables […] seemed to present a low between-day reliability”. Unfortunately, input measurement reliability and questionable testing procedures are largely overlooked in the “take-home” messages and conclusions as a potential cause of error.
However, there are several clear issues with the papers discussed above, including: mixing constrained and unconstrained movements within the same testing, lacking participant familiarity with unloaded/loaded jumps, large and potentially fatiguing testing volumes, inconsistent starting position (and so push-off distance) and variable jump height between test and retest. For example, Valenzuela et al. reported a starting position with an approximate resolution of ±1 to 3 cm and a variability of 2 to 4 cm (i.e., 5 to 10%) can be observed in Lindberg et al.’s study raw data (available online with the study, and the reviewers’ comments). Although the authors discussed this point as a potential explanation of the observed poorer reliability compared to previous studies, they still concluded that the FV profile itself was not reliable in general. Of greater concern, Lindberg et al.’s reported inter-session variability in jump height without additional load was on average 4.9 to 6.4% (i.e., 1.9 to 2.5 cm) with 25% of the subjects exhibiting variability >8%. Comparable variability was reported by Kotani et al (~3.5 cm; ~10%) and Valenzuela et al. (~2.4 cm; ~7.8%). This may arise from non-standardization in testing procedures, but also on biological error. In both cases, the FV relationship concept and the associated computational methods are not the (only) cause of variability in FV outputs. The biological variation in ballistic capacity between two sessions is an interesting and important point to consider for FV profiling (whatever the task considered); nevertheless, it was largely overlooked in these paper abstracts and conclusions as a core explanation of the poor reliability metrics observed. Given acceptable reliability in jumping FV relationships consistently observed by independent research groups (see the numerous references cited here, some of which were overlooked by the authors…), an alternative conclusion should have considered the context in which the results were witnessed: if input data are highly variable – caused by poor testing procedures (e.g., associated with field testing) or high biological variations (e.g., population or context specific) – FV outputs will be unreliable.
This is what Fessl et al. have observed in a study comparing elite alpine skiers (very familiar with jump and loaded jump testing) and less task-experienced physical education students. As expected, the FV reliability data was much poorer in the latter group. So populations show different levels of reliability, more than the FV concept itself.

More surprisingly, a few months after having concluded that FV profile variables in jumping are unreliable, and cautioned their use, the very same authors (Lindberg et al.’s group) published a training study aiming to improve physical performance measures based on athletes’ strengths and weaknesses per an FV profiling approach. They showed that individualized training (based on unreliable indices, per their previously published work) did not provide any advantage compared to non-individualized training. This contrasted with previous studies from different groups (e.g. Jimenez-Reyes et al. 2017 and 2019; Simpson et al. 2021, and the most recent one by Barrera et al.2023), and Lindberg et al.’s conclusion was very confusing in underlining that strength training should focus “on improving power across the entire FV-continuum, regardless of initial FV-profiles”.
Beside affecting reliability, the different points mentioned above can influence the concurrent validity observed when comparing the outputs between methods. One condition required to ensure validity of FV profiles in vertical jumps (and notably when using our method) is that all jumps must be done with the same range of motion (hpo). If hpo varies across the different conditions used to draw the FV curve, this adds noise to the FV curve, and so in the main outputs. This is even more evident when using the computation method since hpo is determined a priori: if the hpo value used in the computations is different from the true hpo that occurred during the jump, F, V and P obtained with the computations will be different from the values observed by the force plate. We assume this is the explanation for the results of a recent study by Hicks et al.(2021), which reported high reliability but lower concurrent validity with the gold-standard method. While they observed ~12% difference in push-off average velocity during jumping between force-plate measurements and simple method computations, they reported high variability of hpo (ICC from 0.77 to 0.95, CV from 4 to 5%). Since hpo was measured a priori when using the computation method, this variability could not be considered. However, again, the method itself was not the problem. The issue was the poor standardisation of the starting position across the conditions (be it inherent or not to the field testing). In research where the starting position was strongly standardised and carefully checked (eg Giroux et al. 2015, Garcia-Ramos et al. 2019, Samozino et al. 2008, Jimenez-Reyes et al. 2017), the agreement with force plate data has typically been good. Instead of concluding “it is not recommended for practitioners to use the computational method”, a more accurate message could have been formulated, which would have signalled greater utility for sport practitioners: “the computation method is highly reliable, but be cautious, as it is very sensible to variability in starting position setting.” Yet “simple, the computational method requires more rigor than the gold standard method.
To address these important points, a recent and comprehensive study by Samozino et al. (invited commentary to read here) shows that linear fit quality of the FV regression decreased when variability in jump height (h) and push-off distance (hpo) increased: a variability in hpo and h lower than 2-3% seems acceptable to guarantee well fitted FV relationships. Once the non-acceptable FV relationships were removed, the simulations showed that when aiming at estimating FV outputs with typical-error <10% (i.e., a common threshold in sport science), the noise must be <2-3% in hpo and h (i.e., both ~1cm). Unsurprisingly, h and hpo variability in the three above-mentioned studies are clearly higher than these theoretical thresholds.
Consequently, the inflated variability observed in the output variables is mainly caused by input variability, rather than the FV relationship or “profile” concept, per se.
Tweet
More generally, the distinction between poor reliability in data measurements, validity of models or testing methods and relevance of biomechanical and physiological concepts can be discussed whatever the physical qualities evaluated. For example, the above observations for FV in jumping apply to sprint running: should split times or instantaneous velocity be measured unreliably, FV output variables will be similarly unreliable, and vice versa. In the same manner, with unreliable gas exchange measurements (e.g., uncalibrated machine, athletes not presenting maximal effort, or other non-standardized testing procedures), maximal oxygen uptake (VO2max) will appear unreliable. However, it would be misleading to conclude that the concept of VO2max itself is unreliable or flawed. As such, this is not a valid reason to caution using VO2max measurements for athletic testing.
Before challenging concepts, approaches, models or methods, balanced recommendations should rather list all sources of measurement uncertainty and provide suggestions to improve subsequent interventions.
Tweet
And compare results to the entire literature, not just a few selected studies published in the last 5 years. For FV testing in jumping, increased measurement noise inevitably leads to unreliable outputs; such noise can be reduced by averaging several trials or considering peak values among several trials, increasing the range of velocity covered and the number of the experimental conditions used to draw the FV relationship, using live feedback during testing to redo incorrect trials, following a warm-up that includes the range of loads to be used during measurement, and thoroughly standardizing starting position. More importantly, all participants must be accustomed with maximal intent loaded jumps, and follow stringent technical criteria (e.g., no countermovement during squat-jump, and landing with fully extended lower limbs when using flight time). External encouragement should be maintained to ensure maximal effort while ensuring the number of trials/loads to not induce fatigue.
Conclusion
Whatever the cooking method, it is impossible to create a tasty dish with spoiled ingredients. I can design a testing protocol, recruit participants, and generate unreliable FV profiles in sprint cycling, running, leg-press or squat jump, very easily. Accordingly, I can even myself sprint cycle or run with submaximal effort, and leg-press or squat jump in a very unreliable way. I will of course obtain poorly linear FV relationships, make errors in extrapolating them, and in turn obtain unreliable F0, V0 and FV slope values. The problem is that the main reason for my poorly reliable outcomes is my own performance during the test. Will I overlook most studies mentioned in this post and publish my data within a “FV is unreliable” paper, that will get published if I’m lucky and reviewers don’t care, don’t know the literature, or worst, have an anti-FV or reactionary personal agenda?
There is a considerable difference between “it does not work” and “be careful, in this context, or done this way, it does not work”.
To be clear – should the FV method provide results that are, in the best case (well standardised, with precise equipment, and habituated athletes etc.), impractical due to large error rates and variation, this is an important finding that should be published. Furthermore, should minimizing variation make the method relatively impractical (too rigorous, too difficult to implement in young athletes etc.) – this is another interesting and practically applicable point that should be presented and discussed. Nevertheless, both of these factors rely on authors doing their due diligence and examining the origins in testing error, and doing so objectively in respect to the decades of research available on the topic (at least, applying to FV studies).
Contrary to some unsupported claims, FV validity and reliability has been observed by several independent research groups over the world, consistently for almost a century, in various types of multijoint exercises. What is consistent in science becomes used if it is useful, what is used may become popular, what is popular may generate hostility. Of course, science is about both replication and refutation. It is also about comprehensive analysis of the literature, sound and fair arguments (discussion about this argument fallacy to come in Part 2).
Challenging well-admitted rules is the essence of science. But when an observation is in contrast with a well-admitted rule, challenging the observation should come first before challenging the rule.
REFERENCES
- Alcazar J. et al. On the Shape of the Force-Velocity Relationship in Skeletal Muscles: The Linear, the Hyperbolic, and the Double-Hyperbolic. Front Physiol. 2019 Jun 19;10:769. doi: 10.3389/fphys.2019.00769
- Barrera-Domínguez FJ et al. Effect of individualised strength and plyometric training on the physical performance of basketball players. Eur J Sport Sci. 2023 Jul 30:1-10. doi: 10.1080/17461391.2023.2238690
- Bassett DR Jr. Scientific contributions of A. V. Hill: exercise physiology pioneer. J Appl Physiol 2002 Nov;93(5):1567-82. doi: 10.1152/japplphysiol.01246.2001
- Best CH, Partridge RC. The equation of motion of a runner, exerting a maximal effort. Proc R Soc London Ser B. 1928;103(724):218–25. Doi: 10.1098/rspb.1928.0036
- Bobbert MF. Why is the force-velocity relationship in leg press tasks quasi-linear rather than hyperbolic? J Appl Physiol. 2012 Jun;112(12):1975-83. doi: 10.1152/japplphysiol.00787.2011
- Cavagna GA et al. The mechanics of sprint running. J Physiol. 1971 Sep;217(3):709-21. doi: 10.1113/jphysiol.1971.sp009595
- Cross MR et al. Methods of Power-Force-Velocity Profiling During Sprint Running: A Narrative Review. Sports Med. 2017 Jul;47(7):1255-1269. doi: 10.1007/s40279-016-0653-3
- Cuk I et al. Force-velocity relationship of leg extensors obtained from loaded and unloaded vertical jumps. Eur J Appl Physiol. 2014;114(8):1703–14. Doi : 10.1007/s00421-014-2901-2
- Dorel S et al. Force-velocity relationship in cycling revisited: benefit of two-dimensional pedal forces analysis. Med Sci Sports Exerc. 2010 Jun;42(6):1174-83. doi: 10.1249/MSS.0b013e3181c91f35
- Driss T, Vandewalle H. The measurement of maximal (anaerobic) power output on a cycle ergometer: a critical review. Biomed Res Int. 2013;2013:589361. doi: 10.1155/2013/589361
- Feeney D et al. Loaded Vertical Jumping: Force-Velocity Relationship, Work, and Power. J Appl Biomech. 2016 Apr;32(2):120-7. doi: 10.1123/jab.2015-0136
- Fessl I et al. Power-Force-Velocity Profiling as a Function of Used Loads and Task Experience. Int J Sports Physiol Perform. 2022 May 1;17(5):694-700. doi: 10.1123/ijspp.2021-0325
- Fornasier-Santos C et al. Sprint Acceleration Mechanical Outputs Derived from Position- or Velocity-Time Data: A Multi-System Comparison Study. Sensors (Basel). 2022 Nov 8;22(22):8610. doi: 10.3390/s22228610
- Furusawa K et al. The dynamics of “sprint” running. Proc R Soc London Ser B. 1927;102(713):29–42. Doi/ 10.1098/rspb.1927.0035
- García-Ramos A et al. Force-Velocity Relationship in the Countermovement Jump Exercise Assessed by Different Measurement Methods. J Hum Kinet. 2019 Jul 5;67:37-47. doi: 10.2478/hukin-2018-0085
- Giroux C et al. What is the best method for assessing lower limb force-velocity relationship? Int J Sports Med. 2015 Feb;36(2):143-9. doi: 10.1055/s-0034-1385886
- Hicks DS et al. Measurement Agreement Between Samozino’s Method and Force Plate Force-Velocity Profiles During Barbell and Hexbar Countermovement Jumps. J Strength Cond Res. 2022 Dec 1;36(12):3290-3300. doi: 10.1519/JSC.0000000000004144
- Janicijevic D et al. Assessment of the force-velocity relationship during vertical jumps: influence of the starting position, analysis procedures and number of loads. Eur J Sport Sci. 2020 Jun;20(5):614-623. doi: 10.1080/17461391.2019.1645886
- Jaric S. Force-velocity Relationship of Muscles Performing Multi-joint Maximum Performance Tasks. Int J Sports Med. 2015 Aug;36(9):699-704. doi: 10.1055/s-0035-1547283
- Jaskólska A et al. Comparison of treadmill and cycle ergometer measurements of force-velocity relationships and power output. Int J Sports Med. 1999 Apr;20(3):192-7
- Jiménez-Reyes P et al. Effectiveness of an Individualized Training Based on Force-Velocity Profiling during Jumping. Front Physiol. 2017 Jan 9;7:677. doi: 10.3389/fphys.2016.00677
- Jiménez-Reyes P et al. Optimized training for jumping performance using the force-velocity imbalance: Individual adaptation kinetics. PLoS One. 2019 May 15;14(5):e0216681. doi: 10.1371/journal.pone.0216681
- Jiménez-Reyes P et al. Validity of a Simple Method for Measuring Force-Velocity-Power Profile in Countermovement Jump. Int J Sports Physiol Perform. 2017 Jan;12(1):36-43. doi: 10.1123/ijspp.2015-0484
- Kotani Y et al. Reliability of the Squat Jump Force-Velocity and Load-Velocity Profiles. J Strength Cond Res. 2022 Nov 1;36(11):3000-3007. doi: 10.1519/JSC.0000000000004057
- Lindberg K et al. Force-velocity profiling in athletes: Reliability and agreement across methods. PLoS One. 2021 Feb 1;16(2):e0245791. doi: 10.1371/journal.pone.0245791
- Lindberg K et al. Should we individualize training based on force-velocity profiling to improve physical performance in athletes? Scand J Med Sci Sports. 2021 Dec;31(12):2198-2210. doi: 10.1111/sms.14044
- Meylan CM et al. The reliability of isoinertial force-velocity-power profiling and maximal strength assessment in youth. Sports Biomech. 2015 Mar;14(1):68-80. doi: 10.1080/14763141.2014.982696
- Morin JB and Belli A. A simple method for measurement of maximal downstroke power on friction-loaded cycle ergometer. J Biomech. 2004;37(1):141–5.
- Morin JB et al. A simple method for computing sprint acceleration kinetics from running velocity data: Replication study with improved design. J Biomech. 2019 Sep 20;94:82-87. doi: 10.1016/j.jbiomech.2019.07.020
- Palmieri G et al. Analytical and multibody modeling for the power analysis of standing jumps. Comput Methods Biomech Biomed Engin. 2015;18(14):1564-73. doi: 10.1080/10255842.2014.930135
- Rabita G et al. Sprint mechanics in world-class athletes: a new insight into the limits of human locomotion. Scand J Med Sci Sports. 2015 Oct;25(5):583-94. doi: 10.1111/sms.12389
- Rahmani A et al. Force/velocity and power/velocity relationships in squat exercise. Eur J Appl Physiol. 2001 Mar;84(3):227-32. doi: 10.1007/PL00007956
- Rivière JR et al. Exploring the Low Force-High Velocity Domain of the Force-Velocity Relationship in Acyclic Lower-Limb Extensions. Sports Med Open. 2023 Jul 13;9(1):55. doi: 10.1186/s40798-023-00598-0
- Rivière JR et al. Where does the One-Repetition Maximum Exist on the Force-Velocity Relationship in Squat? Int J Sports Med. 2017 Nov;38(13):1035-1043. doi: 10.1055/s-0043-116670
- Samozino P et al. A simple method for measuring force, velocity and power output during squat jump. J Biomech. 2008 Oct 20;41(14):2940-5. doi: 10.1016/j.jbiomech.2008.07.028
- Samozino P et al. A simple method for measuring power, force, velocity properties, and mechanical effectiveness in sprint running. Scand J Med Sci Sports. 2016 Jun;26(6):648-58. doi: 10.1111/sms.12490
- Samozino P et al. Optimal force-velocity profile in ballistic movements–altius: citius or fortius? Med Sci Sports Exerc. 2012 Feb;44(2):313-22. doi: 10.1249/MSS.0b013e31822d757a
- Samozino P, Rivière JR, Jimenez-Reyes P, Cross MR, Morin JB. Is the Concept, Method, or Measurement to Blame for Testing Error? An Illustration Using the Force-Velocity-Power Profile. Int J Sports Physiol Perform. 2022 Nov 10;17(12):1760-1768. doi: 10.1123/ijspp.2021-0535
- Simpson A, Waldron M, Cushion E, Tallent J. Optimised force-velocity training during pre-season enhances physical performance in professional rugby league players. J Sports Sci. 2021 Jan;39(1):91-100. doi: 10.1080/02640414.2020.1805850
- Valenzuela PL et al. Should We Base Training Prescription on the Force-Velocity Profile? Exploratory Study of Its Between-Day Reliability and Differences Between Methods. Int J Sports Physiol Perform. 2021 Jul 1;16(7):1001-1007. doi: 10.1123/ijspp.2020-0308
- Yamauchi J, Ishii N. Relations between force-velocity characteristics of the knee-hip extension movement and vertical jump performance. J Strength Cond Res. 2007 Aug;21(3):703-9. doi: 10.1519/R-20516.1
- Zivkovic MZ et al. A simple method for assessment of muscle force, velocity, and power producing capacities from functional movement tasks. J Sports Sci. 2017;35(13):1287–93. Doi : 10.1080/02640414.2016.1221521
