Written with Dr Pierre Samozino (University Savoie Mont Blanc)
Due to popular demand and frequent requests from sport practitioners and researchers, we have decided to publish a spreadsheet and tutorial for implementing our sprinting FVP field method based on split times measurements during a 30-m, all-out sprint acceleration, from a standing (2 or 3-point) start. This simple method has been initially proposed and validated against force plate data by Samozino et al. in 2016, and used afterwards in several publications (see here).
Download this spreadsheet HERE.
Watch the 10’ video tutorial here:
This spreadsheet will automatically calculate the sprint force-velocity profile based on the following input variables: 5 split times over a 30 or 40-m acceleration, air temperature and pressure, stature and body mass of the athlete, based on the modeling of the position-time curve by an exponential function.
After a quick adjustment of the 2 variables of the exponential model (maximal velocity Vmax and time constant Tau) to fit the actually measured split times, it will automatically display the FVP curves, the main mechanical outputs and the mechanical effectiveness. Note that you will need to install/use the Excel Solver add-in macro for this adjustment.
For full details on the definition and practical meaning of these variables, please read this commentary paper.
In addition to exploring your athlete’s performance, it will indicate the underlying mechanical variables, and help you design more effective, individualized training content.
Furthermore, in the context of rehabilitation and return-to-sport processes, knowing an athlete’s pre-injury profile is gold to an effective, sprint-oriented rehabilitation and return-to-sport decision. See Jurdan Mendiguchia’s works on the topic in 2014, 2016 and 2017.
This “profiling” test may be done with only 4 split times (5, 10, 20, and 30m), but for more accuracy we recommend using 5 or 6.
As to the devices needed, well, it’s up to you, any device that accurately measures split times may be used: timing gates, iOS app MySprint, etc… But one thing is important to keep in mind: the most important thing to ensure that the measurements are valid and the data make sense is that the time measurement starts as soon as any propulsive action is produced. So what we recommend if you are using timing gates and not the iOS app MySprint, is that a system that reacts to the athlete’s first propulsive action triggers the timing (see review here). In case of a trigger by a first pair of cells (eg 20 or 50 cm in front of the athlete’s starting position), the split times will be underestimated, and thus F0 and Pmax variables will be largely overestimated. This is how soccer players are sometimes described as “faster than Bolt” in the News! When using this starting procedure, the athlete’s body has in fact a high forward velocity at the moment of triggering, which leads to erroneous values and performance/mechanics overestimations. For the same reasons, a standing start from a still position must be used.
Finally, this is a short list of normative values for the different mechanical variables, ranging from physically active (male) individuals with no specific sprint experience to elite athletes (mostly rugby players or sprinters), based on our own experience (please see the literature on the topic for more details).
F0 (N/kg): from 3-4 to 10-12 N/kg
V0 (m/s): from 5 to 12 m/s
Pmax (W/kg): from 6-7 to 25-30 W/kg
RF max (%): from 20 to 60%
Drf (%): from -10 to -4%
Note that our group will soon publish an extensive database for both male and female athletes.
Should you obtain values beyond these standards, don’t blame the method or the spreadsheet, the issue is with the device used to measure split times, and/or the starting/triggering procedure. See our recent discussion on these overestimations here.
Using this model, this is the FVP profile of Usain Bolt during the current 100-m World Record:
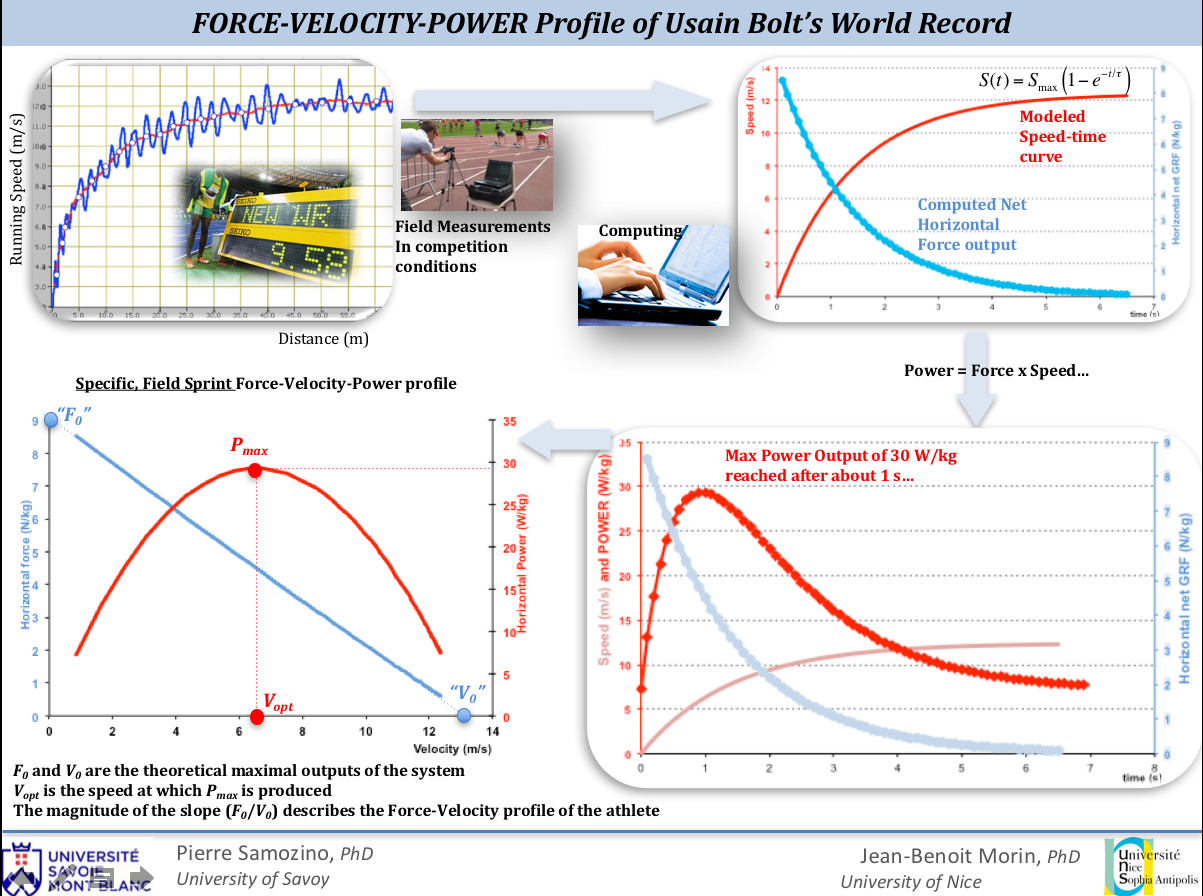 |
| Usain Bolt’s 100-m record force-velocity-power profile |
Ready, Set, Enjoy!

Dr. Morin,
How do you propose one use external mechanical power-time signature to train effectively? Would the goal be to see maximum power delivery or the rise time of the power-time signal or both? Secondly, what is the implication of not being able to quantify internal power to move hands and limbs? This appears to be a significant omission to the analysis and (unfortunately) there maybe no easy field based way to quantify this? Shouldn't additional accelererometers on the hands for example be able to communicate this information to a center accelerometer?
LikeLike
Your site is very useful for me,Thanks for your sharing.
หนังสยองขวัญ
LikeLike
Hi Ron, thanks for your comments,
the training associated with the “signature” has been partly addressed in our invited comment in International Journal of Sports Physiology and Performance and we've started to run some experimental studies to test what training intervention is useful to improve what variable in the profile (eg recently published study on the effects of very heavy sled on the “Ratio of Force” variable
Our approach is based on an integrative approach based on the overall motion of the body so yes we can not assess “internal” work but as it relates to sports performance the most important is how body moves relative to the ground rather than how segments move relative to the body
as you said, no easy way to quantify it !!
accelerometers may be a track of research, but tough game ! to eventually know something that may not be relevant to performance on the track/field, i.e. how segments move around the CoM
jb
LikeLike
In the speadsheet tha cell called FV slope (cell E13) this is the FVimb from the paper “Interpreting Power-Force-Velocity Profiles for Individualized and Specific Training” am I right? Thus if this value is below 1 the athlete is force – deficit ( and If this value is above 1 the athlete is velocity – deficit?
LikeLike
Dr Morin,
Thank you for sharing your work and helping all of us getting better. Your work has inspired me a lot with my programming and really made me question traditional “truths”. I have used both MyJump and MySprint for a couple of years, and with the 1080 Sprint I get enough data to last a long time. The addition to the spreadsheet add depth to it all and help look into more details.
I only have one issue with the spreadsheet. When I run the solver I get dialoge box saying “solver cannot find a feasible solution. Solver cannot find a point for which all constraints are satisfied”. It says so every time no matter how I adjust the numbers. Is there anything I ca do to fix this? Have I gotten a spreadsheet with a bug?
I get some of the graphs but not all. And some of the data is all wrong. I would love to use the spreadsheet but cannot get it to work.
Thank you again for all your work and effort!
Robert.
LikeLike
Hi Robert ! Thank you for your comments and feedback, much appreciated. This is strange and maybe due to the version of excel or a slight mistake in filling the spreadsheet. Feel free to send me the file so i can check if i find something : jean-benoit.morin@univ-cotedazur.fr
LikeLike
Hi Dr. Morin,
Thanks for sharing this excellent work! I am working on a similar problem for my current research and just wanted to confirm something: when computing the total horizontal force for the y axis of the FV plot, is this force simply ma + kv^2, where the latter term represents the drag force the runner has to overcome? Could you point me to any literature to confirm this assumption? We are trying to understand the full force dynamics for a sprinter and want to make sure we have this right. Is this force the net horizontal GRF experienced by the runner? Any helps is appreciated!
LikeLike
Thank you Kevin yes that’s exactly it please send me an email vos the contact button of the website so I can send you the related research papers 👍
LikeLike
Hi Dr. Morin, In data entry for a 40yd FVP profile, is it possible to use only 4 timing gates and use the flying 10yd, or flying 20yd split times in addition to initial 10yd, 20yd, and 40yd to make 5 times? If so, how would you enter those flying times.
LikeLike
Hi Kamau, the model is based on the use of split times over the acceleration, so not flying times, the minimal valid times tested in research are: 5, 10, 20 and 30m, more is better, adding 40m is important for very fast athletes, and less will lead to inaccurate computations
LikeLike